Fig. 11.
Download original image
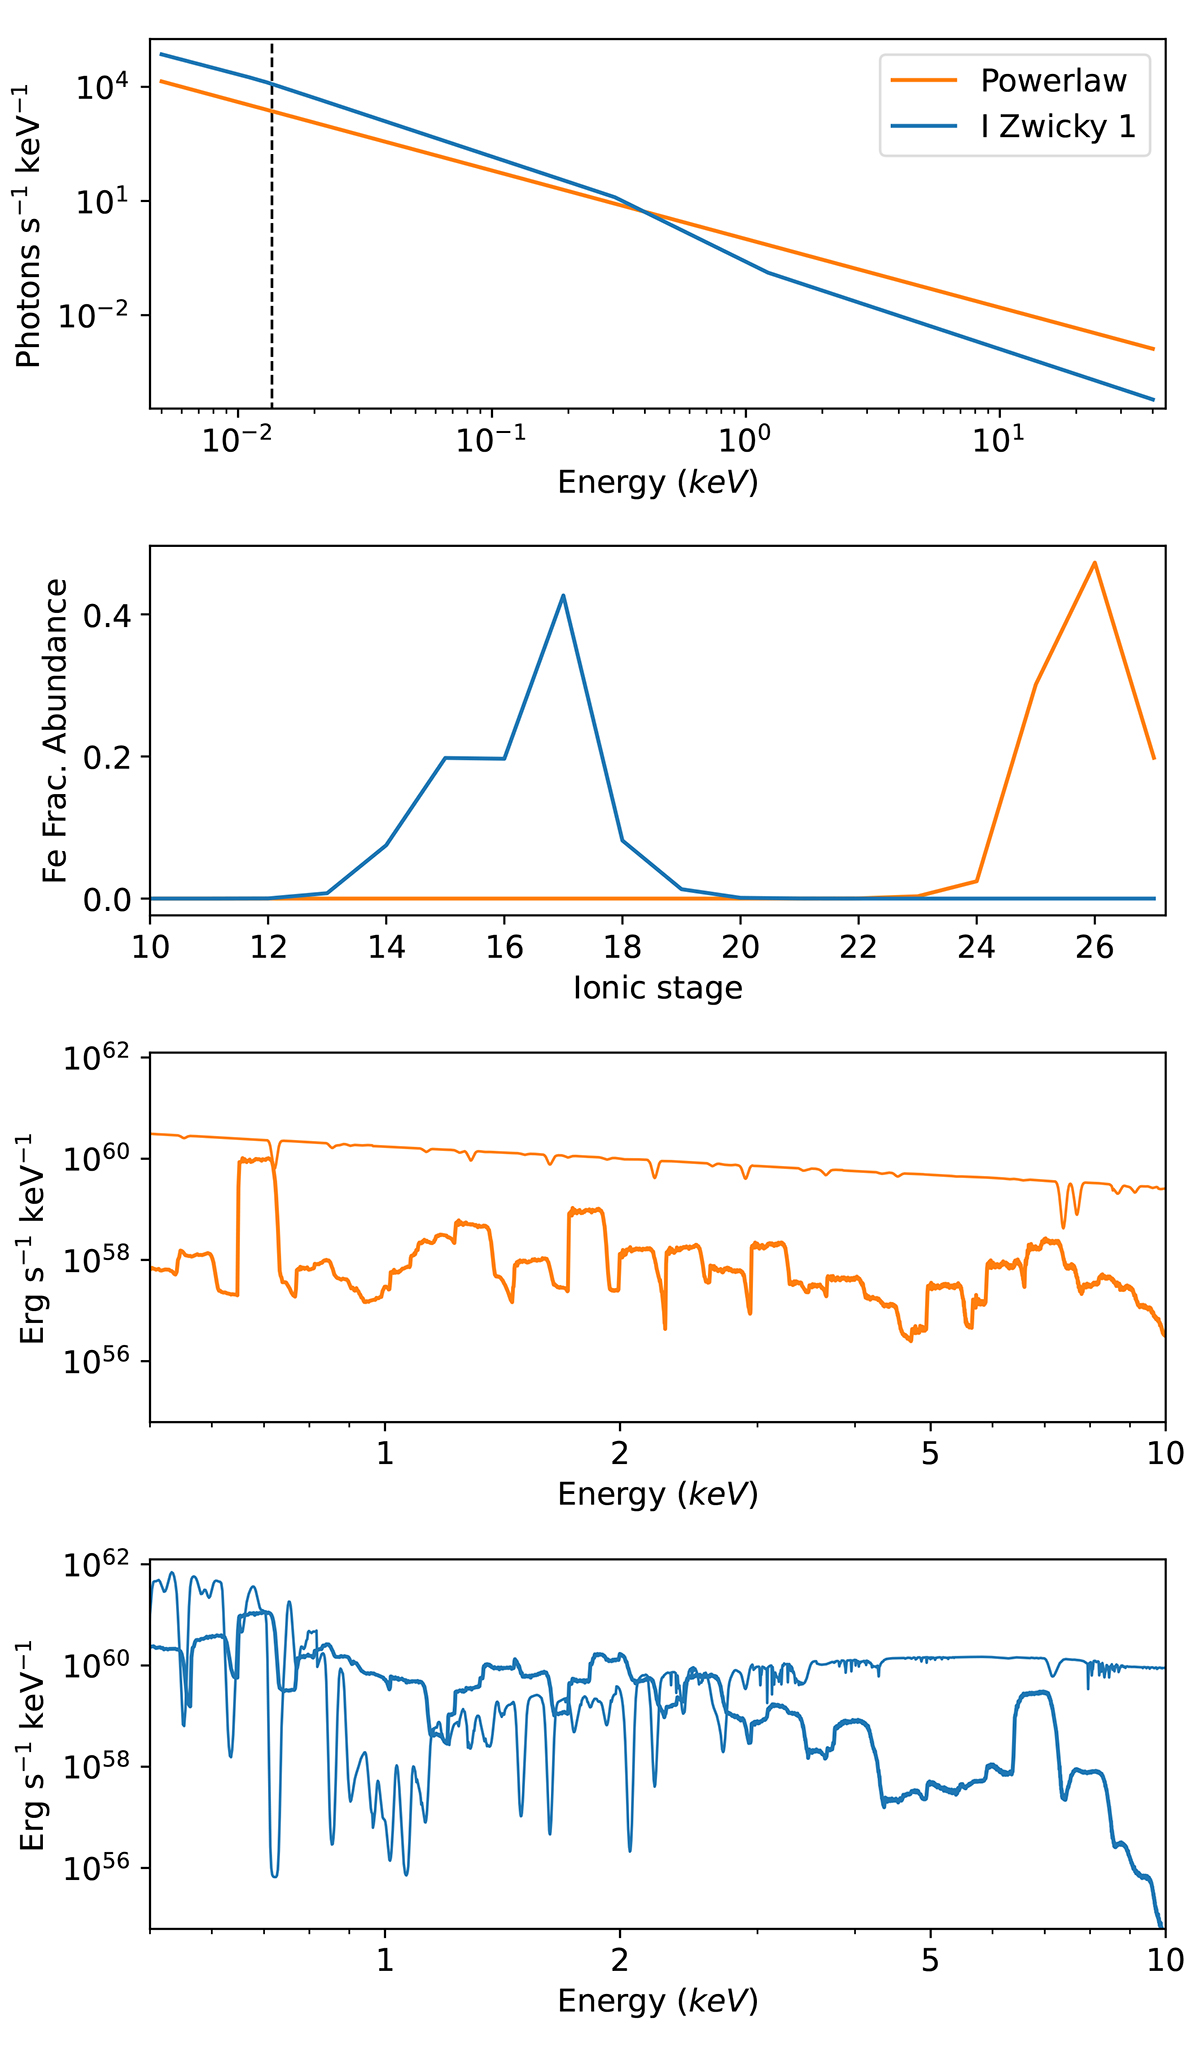
Impact of the SED on the photoionised gas. First panel: Comparison between the powerlaw SED (orange) and the NLSy1 one (blue), in units of photons, s−1 keV−1 (arbitrary normalisation). Second panel: Iron ionic fractional distribution for log(ξ) = 3, NH = 5 ⋅ 1023, v0 = 0.1c and the two different SEDs (colour coding as above). Third and fourth panels: Absorption and emission spectra (thin and thick lines, respectively; units of Erg s−1 keV−1) assuming the powerlaw and the NLSy1 SED, respectively, and the same log(ξ),NH, v0 as in the second panel.
Current usage metrics show cumulative count of Article Views (full-text article views including HTML views, PDF and ePub downloads, according to the available data) and Abstracts Views on Vision4Press platform.
Data correspond to usage on the plateform after 2015. The current usage metrics is available 48-96 hours after online publication and is updated daily on week days.
Initial download of the metrics may take a while.