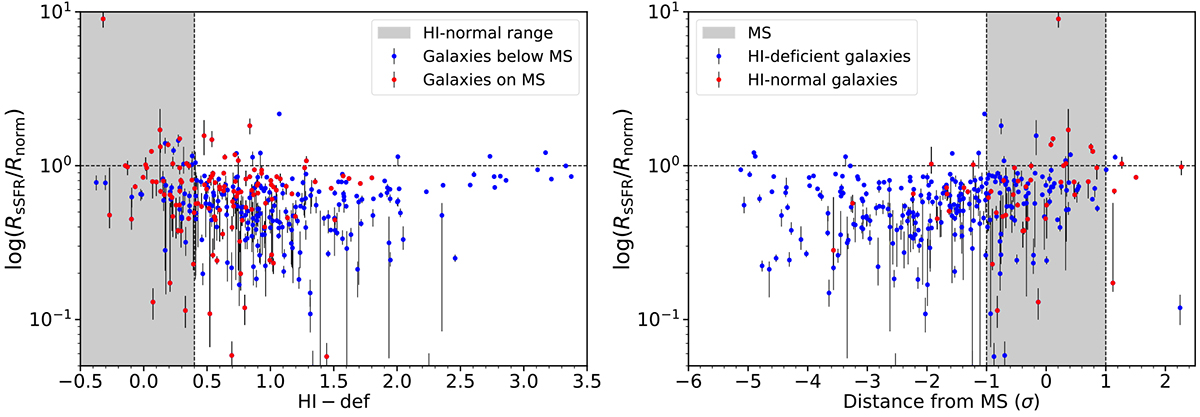
Fig. 6.
Download original image
RsSFR/Rnorm against star formation indicators. Left: RsSFR/Rnorm as a function of H I-deficiency, with galaxies located on or above the SFMS shown in red and galaxies below the SFMS shown in blue. The range of H I-normal galaxies is shaded. Right: RsSFR/Rnorm as a function of distance from the SFMS, with H I-normal galaxies shown in red and H I-deficient galaxies shown in blue. The SFMS is shown as a shaded region.
Current usage metrics show cumulative count of Article Views (full-text article views including HTML views, PDF and ePub downloads, according to the available data) and Abstracts Views on Vision4Press platform.
Data correspond to usage on the plateform after 2015. The current usage metrics is available 48-96 hours after online publication and is updated daily on week days.
Initial download of the metrics may take a while.