Fig. 3.

Download original image
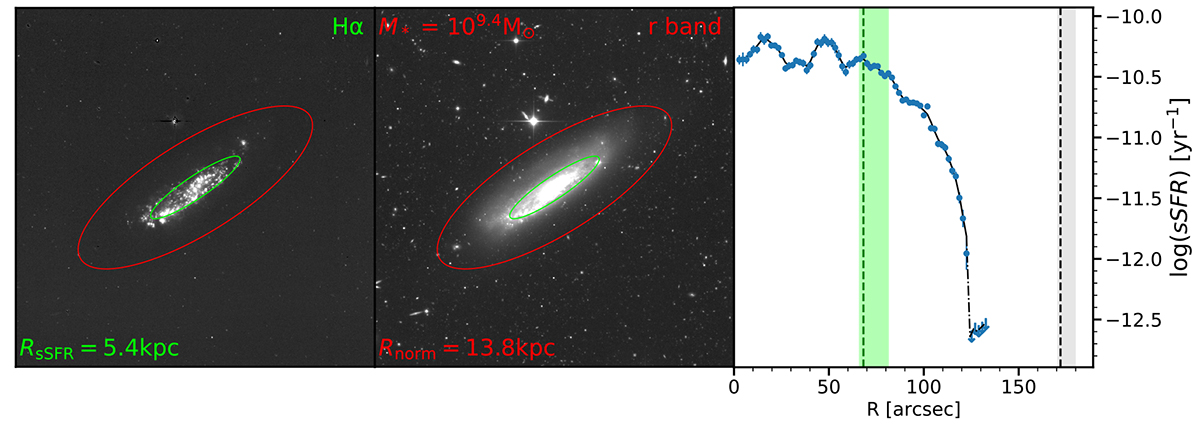
Continuum-subtracted Hα emission (left), r-band optical emission (centre), and sSFR profile (right) for VCC 865 (NGC 4396). In the left and centre postage stamps, the green ellipse outlines RsSFR while the red ellipse outlines Rnorm. On the sSFR plots (right), we show RsSFR and its associated uncertainty range as a green vertical line and band, and Rnorm and its uncertainty range as a grey vertical line and band. Also included are the upper limits (down arrows) in the next five radial bins in which Hα is not detected (but stellar mass is); this represents the upper limit to the sSFR based on the Hα detection limits.
Current usage metrics show cumulative count of Article Views (full-text article views including HTML views, PDF and ePub downloads, according to the available data) and Abstracts Views on Vision4Press platform.
Data correspond to usage on the plateform after 2015. The current usage metrics is available 48-96 hours after online publication and is updated daily on week days.
Initial download of the metrics may take a while.


