Fig. D.2.
Download original image
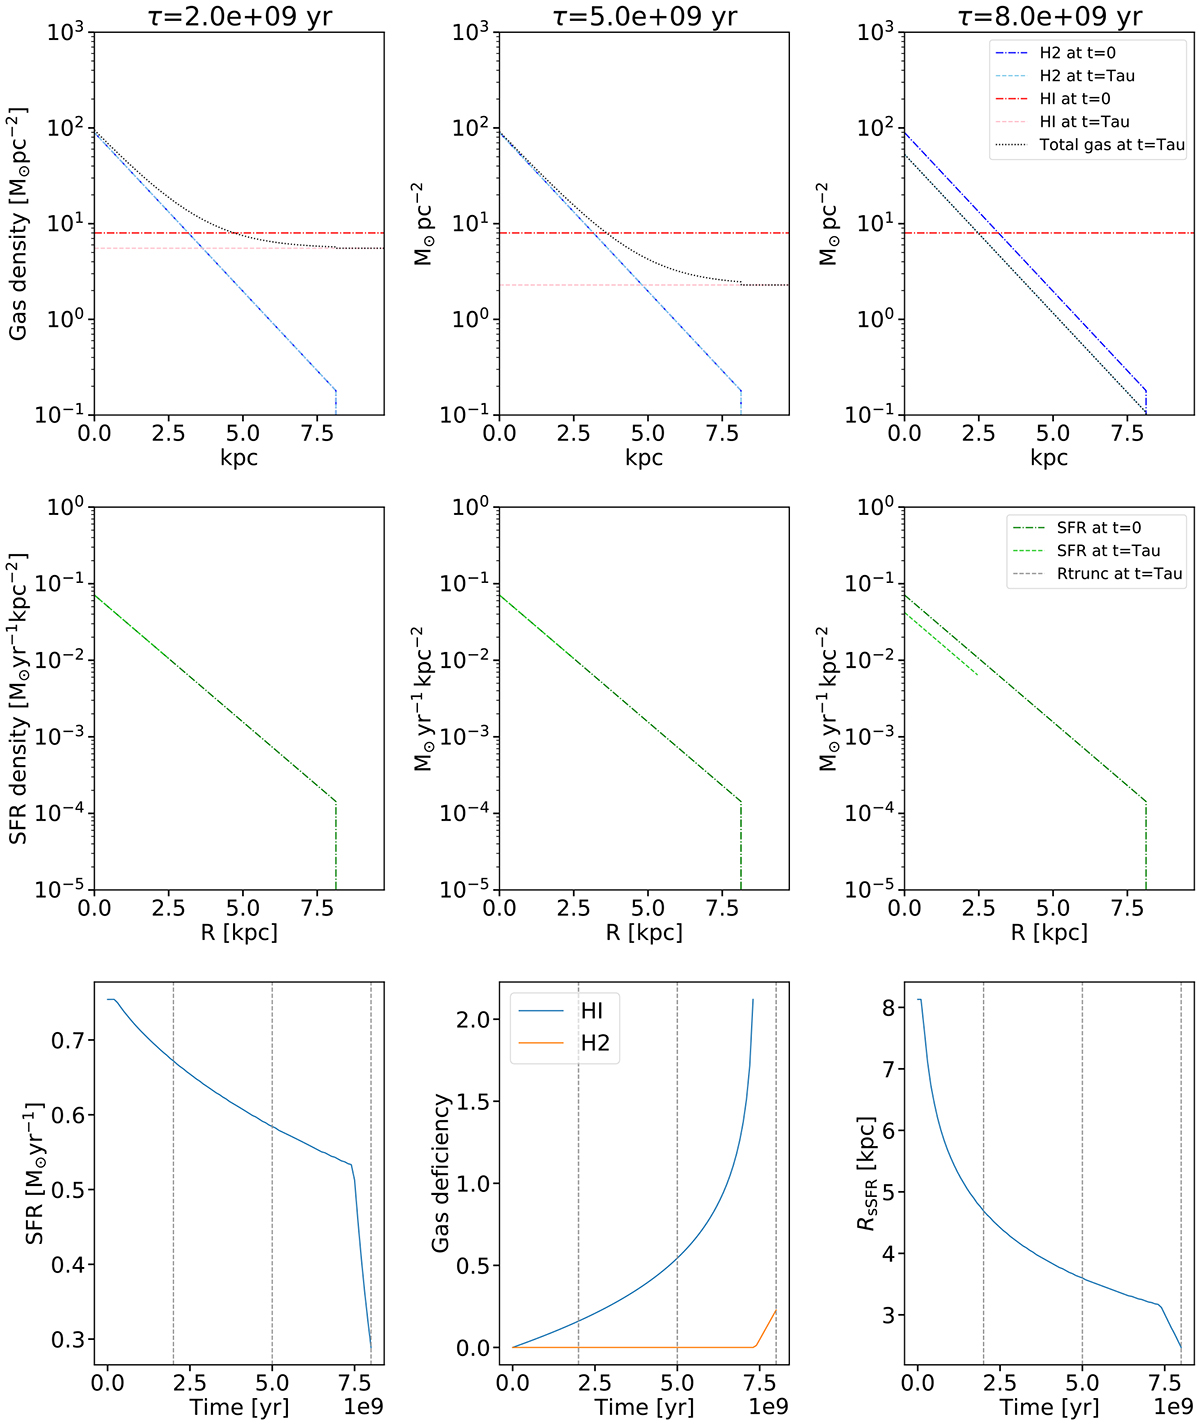
Top: Gas density profiles at three timesteps for starvation model. Initial profiles for H I and H2 are shown in red and blue, respectively while evolved profiles are shown in pink and light blue, respectively. Evolved total gas density profile is shown in black. Middle: SFR density profiles at three timesteps, where the initial profile is shown in green and the evolved profile in light green. The grey vertical line shows RsSFR. Bottom: Time evolution of global SFR, gas deficiency and RsSFR.
Current usage metrics show cumulative count of Article Views (full-text article views including HTML views, PDF and ePub downloads, according to the available data) and Abstracts Views on Vision4Press platform.
Data correspond to usage on the plateform after 2015. The current usage metrics is available 48-96 hours after online publication and is updated daily on week days.
Initial download of the metrics may take a while.