Fig. 12.
Download original image
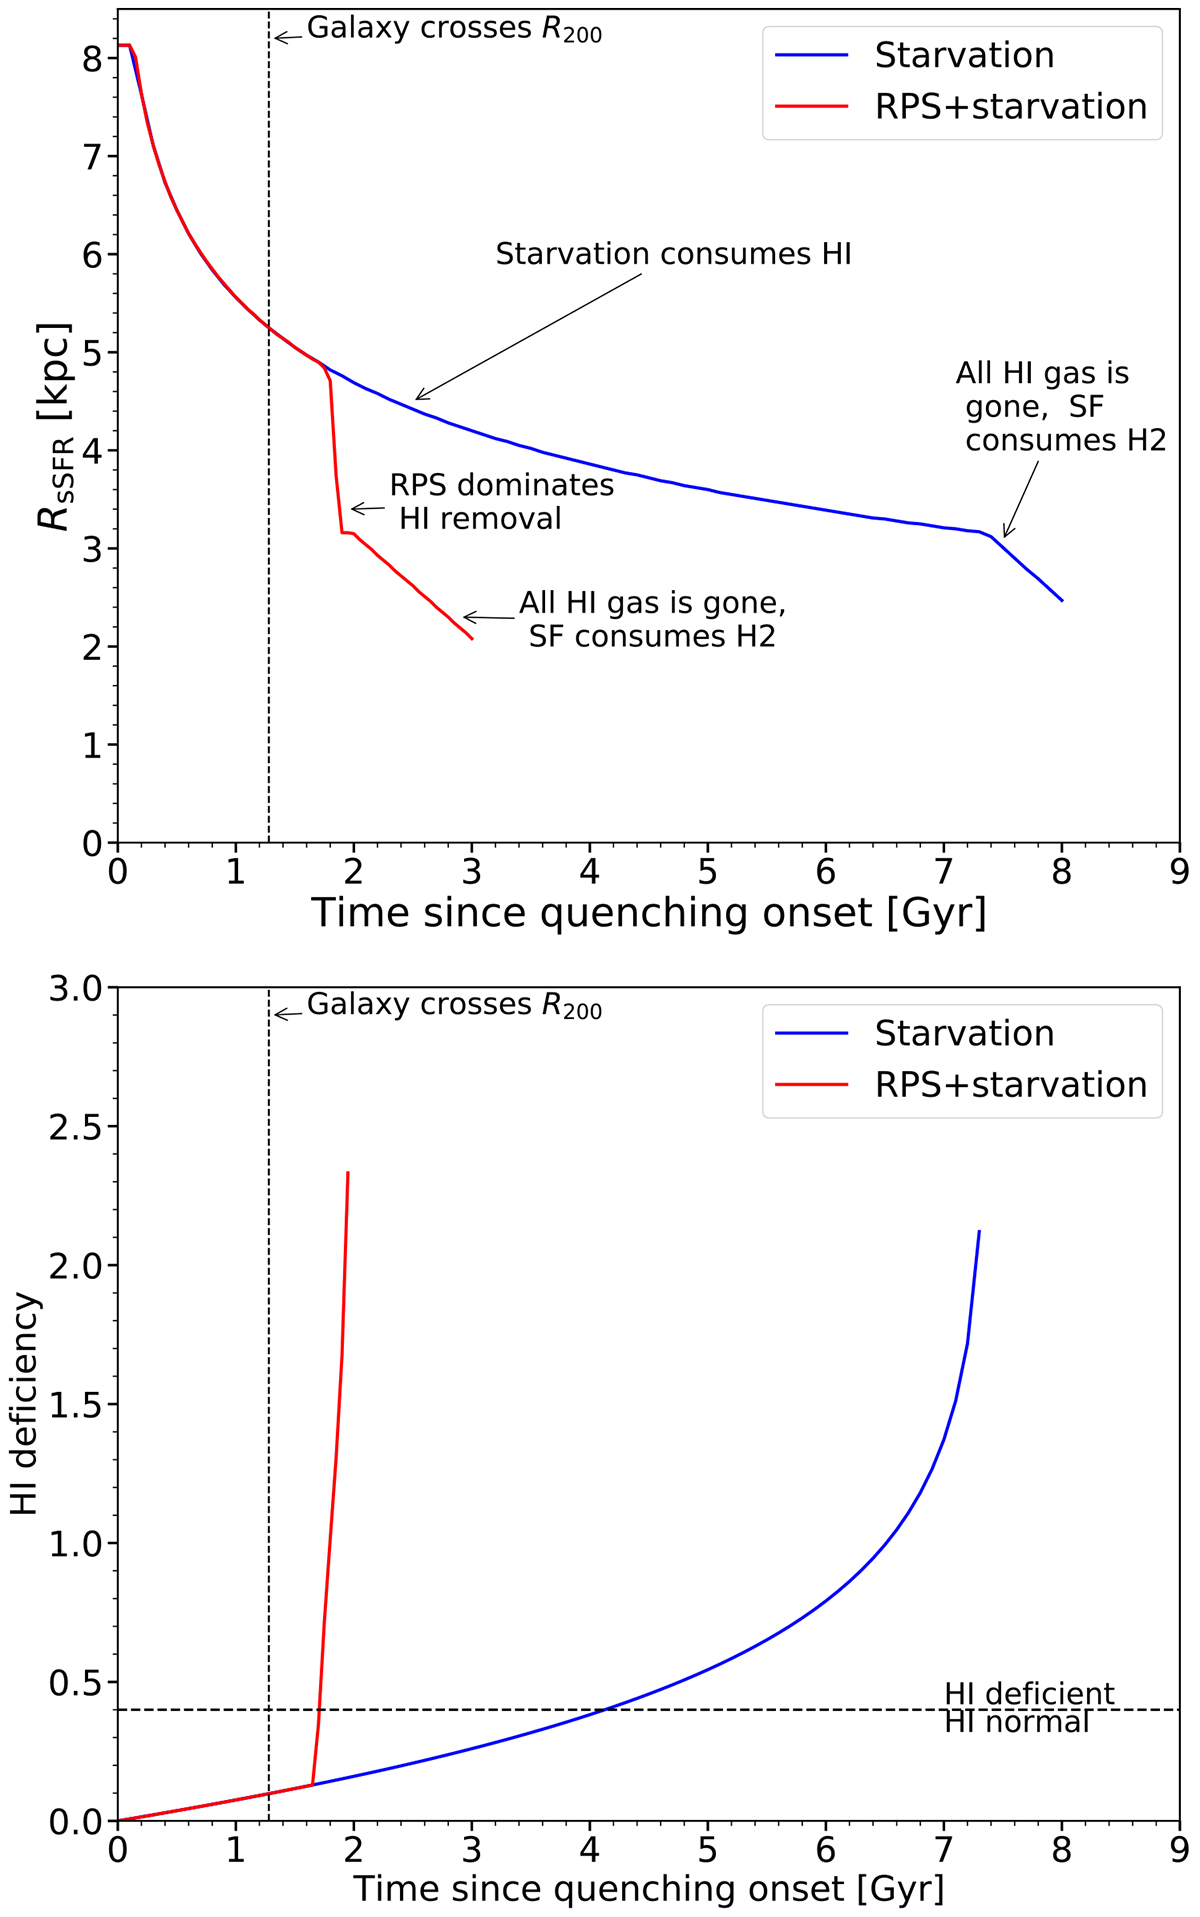
Evolution through time of RsSFR (top) and H I-deficiency (bottom), for a M* = 109.5 M⊙ galaxy undergoing a simple starvation model (blue curves) and a galaxy falling into Virgo radially and experiencing RPS along with starvation (red curves). The horizontal dashed black line at H I-def = 0.4 represents the point above which a galaxy is considered H I-deficient.
Current usage metrics show cumulative count of Article Views (full-text article views including HTML views, PDF and ePub downloads, according to the available data) and Abstracts Views on Vision4Press platform.
Data correspond to usage on the plateform after 2015. The current usage metrics is available 48-96 hours after online publication and is updated daily on week days.
Initial download of the metrics may take a while.