Fig. 11.
Download original image
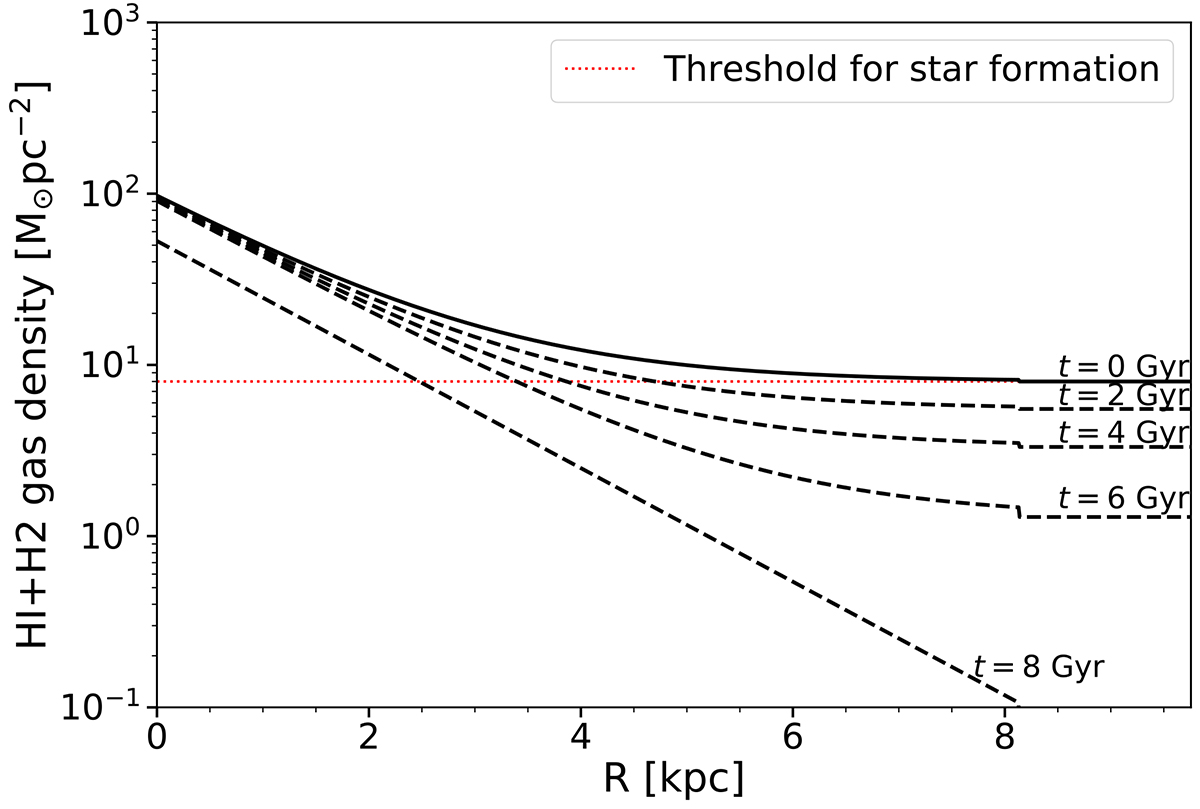
Evolution of total gas density (ΣHI + ΣH2) over 8 Gyr for a ![]() galaxy undergoing simple starvation. The threshold gas density for star formation (explained in Appendix D) is shown as a dashed red line. By the t = 8 Gyr curve, all H I gas has been consumed and as such the H2 is not being replenished, causing the total gas density to decrease at all radii.
galaxy undergoing simple starvation. The threshold gas density for star formation (explained in Appendix D) is shown as a dashed red line. By the t = 8 Gyr curve, all H I gas has been consumed and as such the H2 is not being replenished, causing the total gas density to decrease at all radii.
Current usage metrics show cumulative count of Article Views (full-text article views including HTML views, PDF and ePub downloads, according to the available data) and Abstracts Views on Vision4Press platform.
Data correspond to usage on the plateform after 2015. The current usage metrics is available 48-96 hours after online publication and is updated daily on week days.
Initial download of the metrics may take a while.