Fig. 10.
Download original image
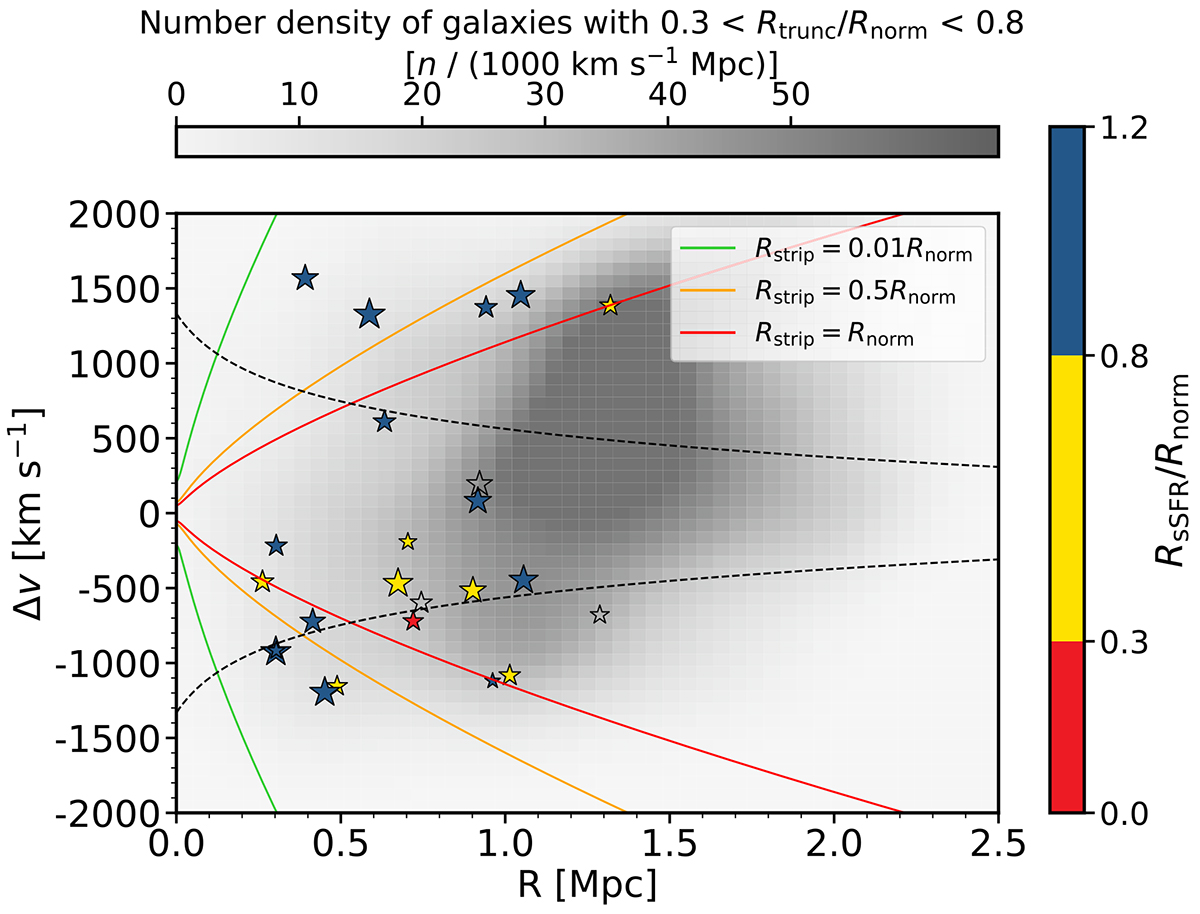
PPS diagram showing the region within the escape velocity of the cluster as the region between the two dashed black lines. The escape velocity is determined based on the NFW profile of Simionescu et al. (2017). The green, yellow, and red lines show the contours where a M* = 109.5 M⊙ galaxy could have its gas removed by RPS from 0.01, 0.5, and 1 Rnorm, respectively, assuming isotropic orbits. Data points are sized proportionally to the stellar mass of the galaxy, and coloured based on the value of RsSFR/Rnorm. The background greyscale shows the phase-space number density of galaxies with 0.3 < RsSFR/Rnorm < 0.7 determined using a 2D Gaussian KDE.
Current usage metrics show cumulative count of Article Views (full-text article views including HTML views, PDF and ePub downloads, according to the available data) and Abstracts Views on Vision4Press platform.
Data correspond to usage on the plateform after 2015. The current usage metrics is available 48-96 hours after online publication and is updated daily on week days.
Initial download of the metrics may take a while.