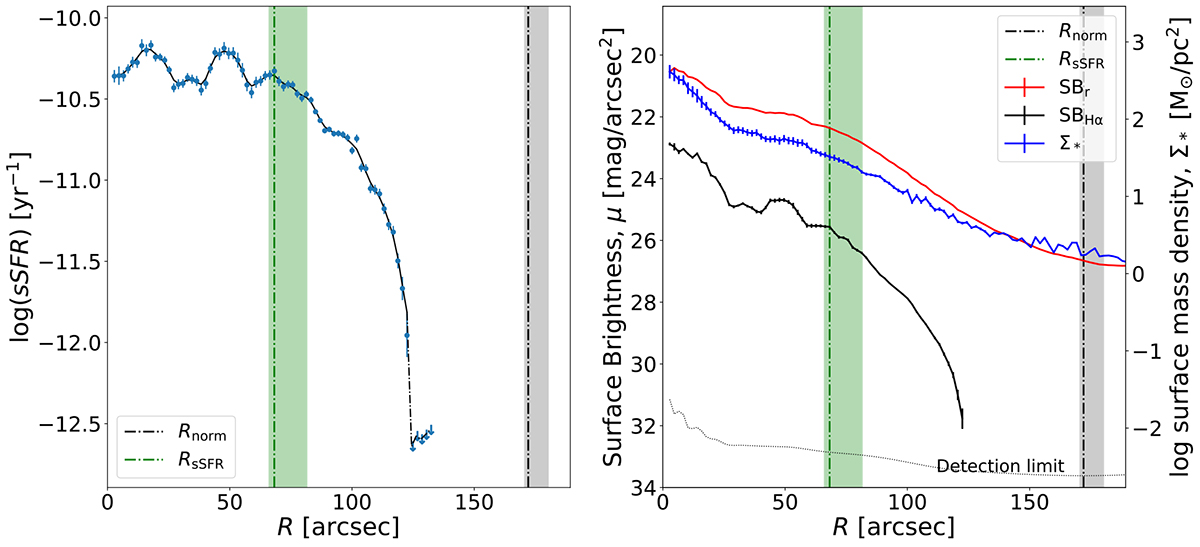
Fig. 1.
Download original image
Radial profiles for VCC 865 (NGC 4396). Left: sSFR profile (blue data points) with a smoothed profile shown as a black curve. The next five upper limits (where no Hα is detected but stellar mass is) are shown as blue arrows, connected by a dot-dashed line. Right: Surface brightness profiles for Hα NB (black) and r-band emission (red), along with the Σ* profile (blue). The dashed black profile shows the detection limit for the Hα profile. In both panels, the green vertical line shows the median SF disc edge, RsSFR, and the shaded green band the uncertainty range based on the 16th and 84th percentiles computed using a Monte Carlo simulation with 1000 iterations. The vertical black line shows the expected edge, Rnorm, of the galaxy and the shaded grey band uncertainty range based on the 16th and 84th percentiles of the Monte Carlo simulation.
Current usage metrics show cumulative count of Article Views (full-text article views including HTML views, PDF and ePub downloads, according to the available data) and Abstracts Views on Vision4Press platform.
Data correspond to usage on the plateform after 2015. The current usage metrics is available 48-96 hours after online publication and is updated daily on week days.
Initial download of the metrics may take a while.