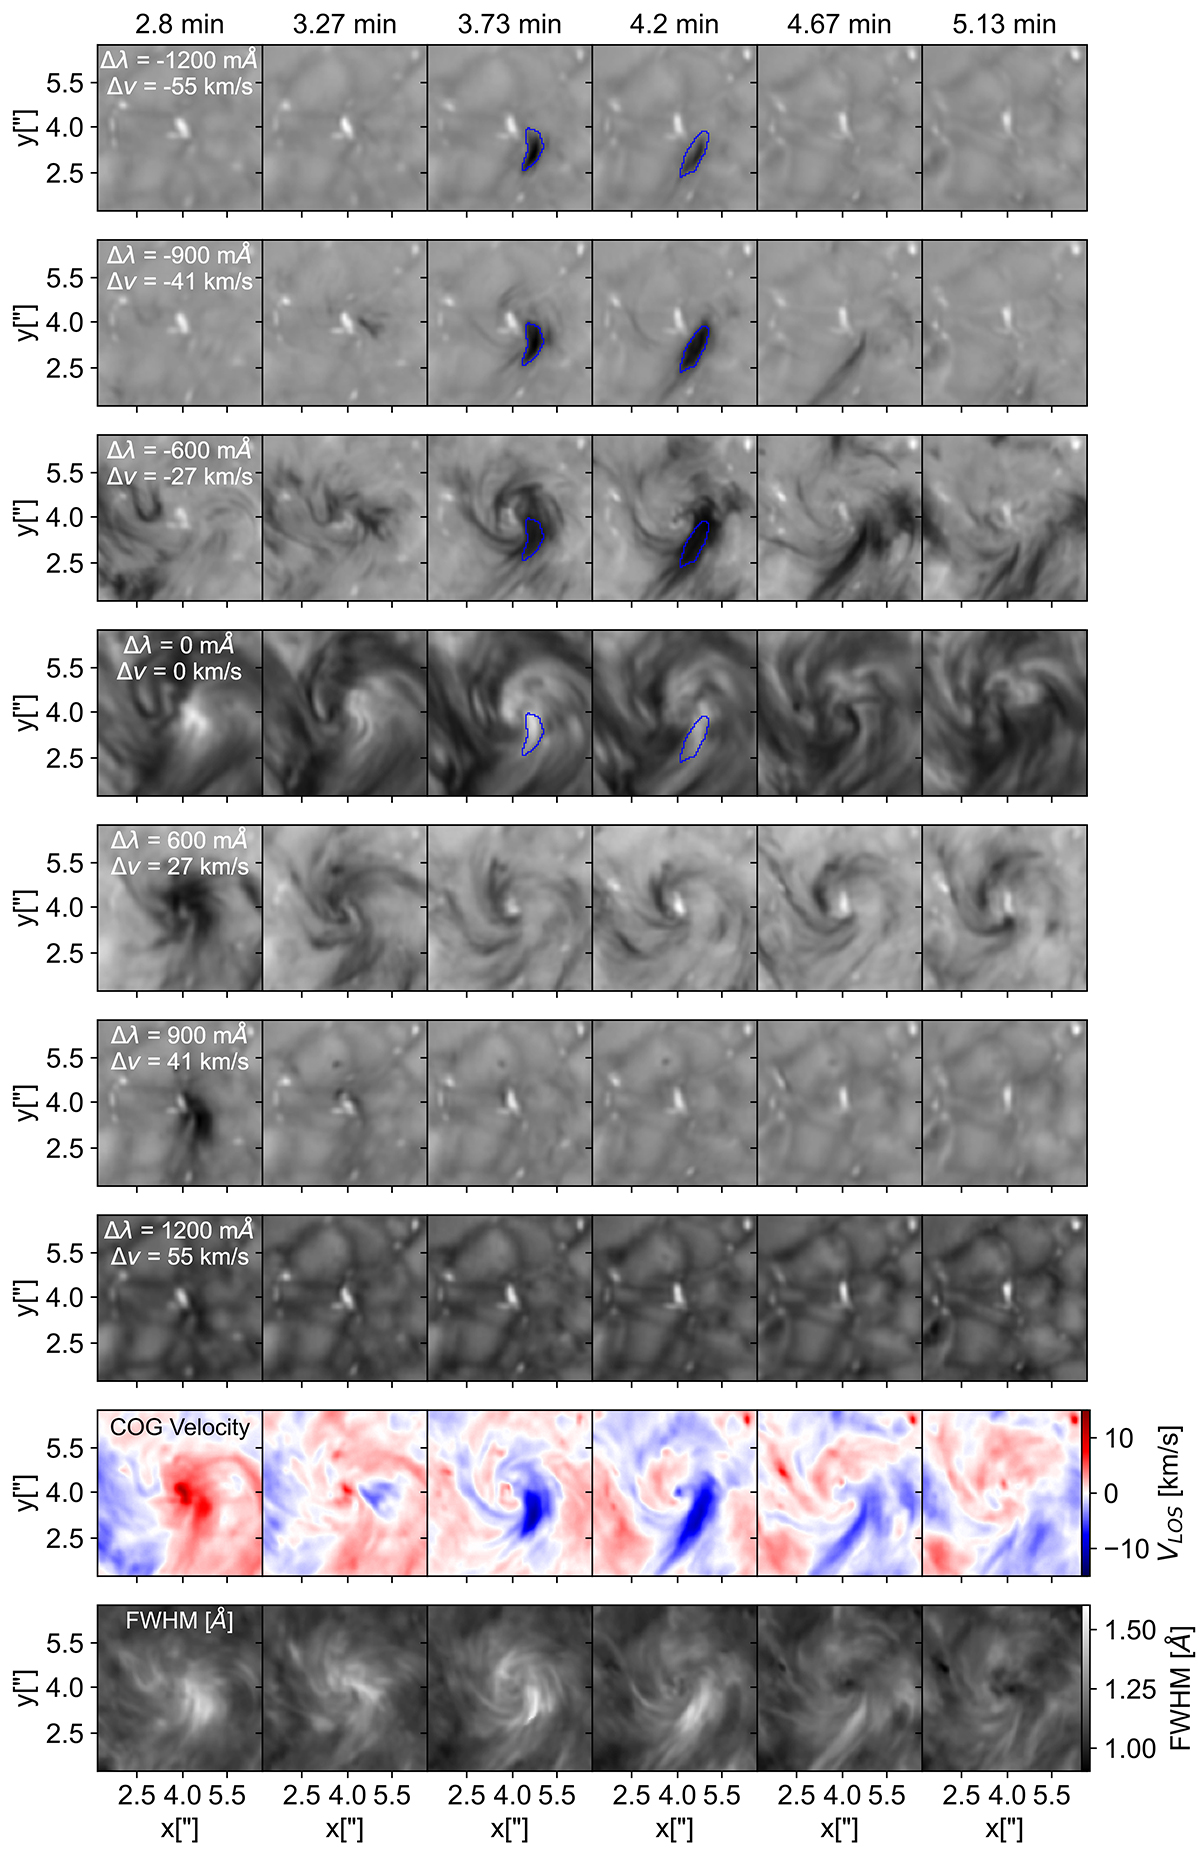
Fig. 9.
Download original image
Detailed cutouts showing the evolution of Hα from t = 2.8 min to t = 5.13 min with 28.2 seconds cadence where the chromospheric jet appears in different wavelength positions, which are indicated within the panels of the first column. The second but last and last row correspond to the LOS velocity based on the Centre of Gravity (COG) method and the FWHM, respectively. The blue contours mark the region of the dark feature at the line position Δλ = −900 mÅ.
Current usage metrics show cumulative count of Article Views (full-text article views including HTML views, PDF and ePub downloads, according to the available data) and Abstracts Views on Vision4Press platform.
Data correspond to usage on the plateform after 2015. The current usage metrics is available 48-96 hours after online publication and is updated daily on week days.
Initial download of the metrics may take a while.