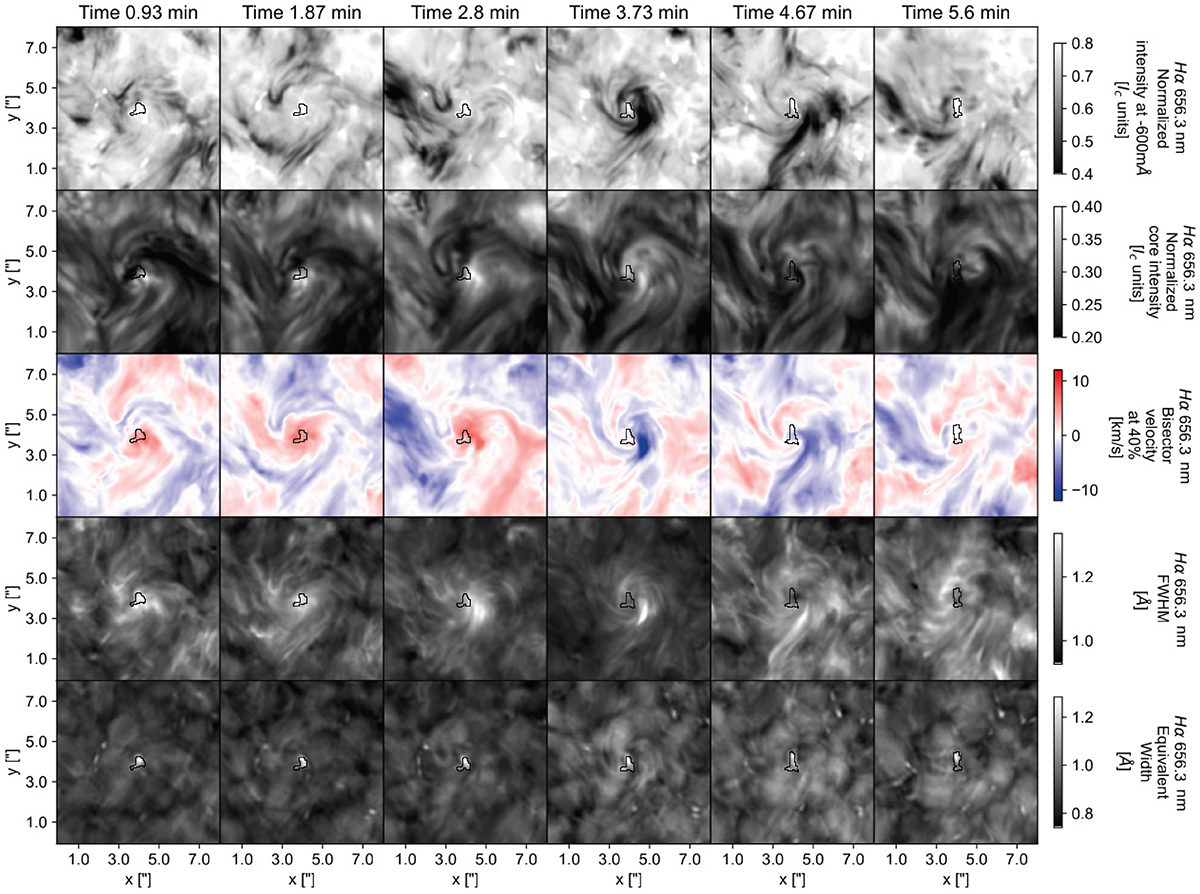
Fig. 8.
Download original image
Time series of maps of various properties of the spectral line Hα at one minute cadence. First row: normalised intensity in the blue wing of Hα at −600 mÅ maps from the line core. Second row: normalised intensity maps in the line core. Third row: Bisector velocity at 70% depth of the Hα line core Fourth row: Bisector velocity at 40% depth of the Hα line core. Fifth and Sixth row: FWHM and EW of Hα, respectively. All maps include a central black contour to show the location, scale, and evolution of the MBP. An animation is available online.
Current usage metrics show cumulative count of Article Views (full-text article views including HTML views, PDF and ePub downloads, according to the available data) and Abstracts Views on Vision4Press platform.
Data correspond to usage on the plateform after 2015. The current usage metrics is available 48-96 hours after online publication and is updated daily on week days.
Initial download of the metrics may take a while.