Fig. 7.
Download original image
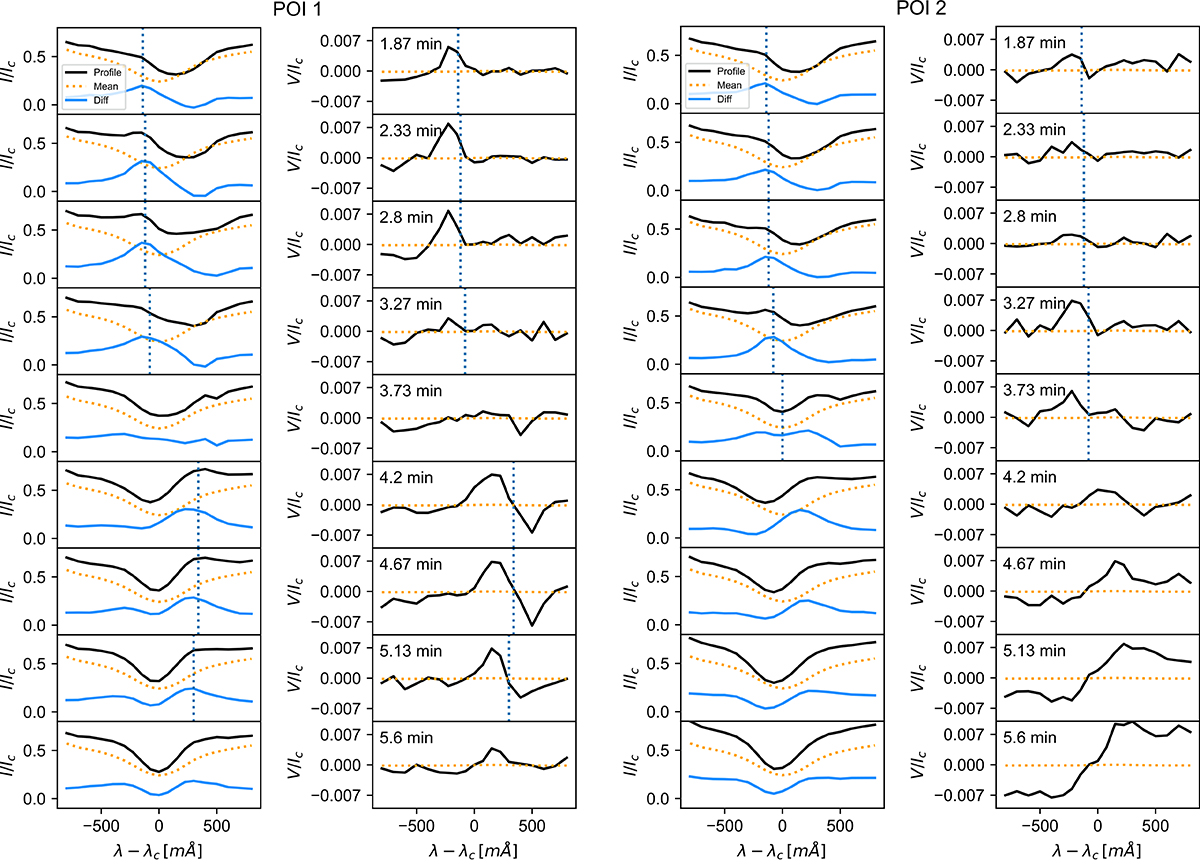
Time sequences of the Stokes-I and V profiles of the Ca II line at 8542.1 Å normalised to the continuum intensity for two points of interest (POI 1 and POI 2) in the close vicinity of the MBP: POI 1 (left plots): black ×-sign in the first row of Fig. 6 and POI 2 (right plots): black +-sign in first row of Fig. 6. The actual line profiles are shown in black, the average profiles over the full FOV and over time are shown in orange, and the blue lines correspond to the difference between the black and orange profiles. Dotted blue vertical lines before t = 3.73 min mark the position of the maximum value of the Stokes-I emission excess for each profile (maximum of the blue curve). Dotted blue vertical lines after t = 3.73 min mark the position of the Stokes-V zero-crossing for the double-lobe signatures in the POI 1 profiles. The sequences start at t = 1.87 min and have a cadence of 28 seconds.
Current usage metrics show cumulative count of Article Views (full-text article views including HTML views, PDF and ePub downloads, according to the available data) and Abstracts Views on Vision4Press platform.
Data correspond to usage on the plateform after 2015. The current usage metrics is available 48-96 hours after online publication and is updated daily on week days.
Initial download of the metrics may take a while.