Fig. 6.
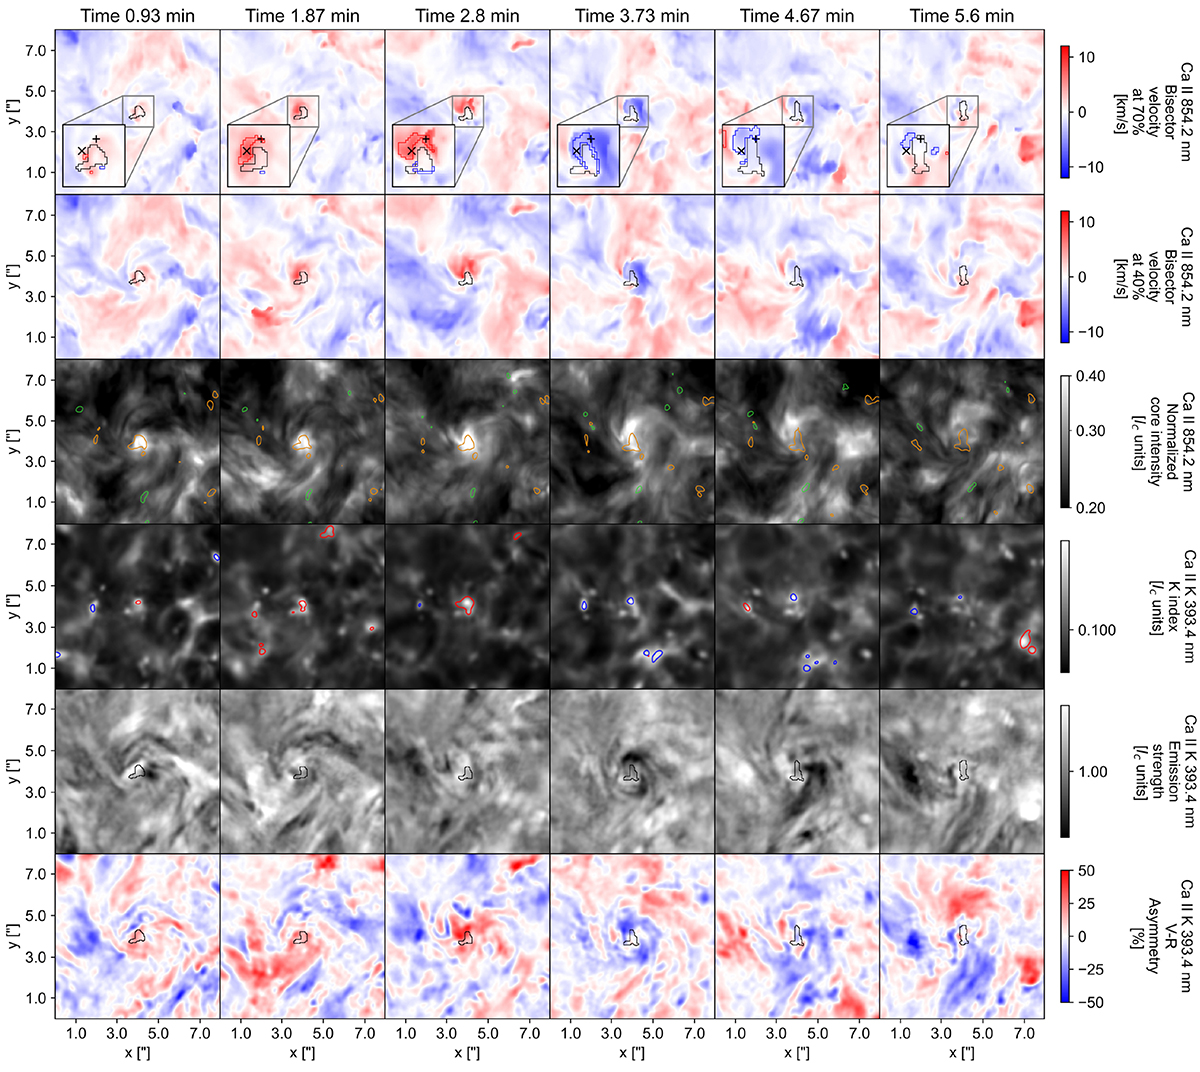
Download original image
Time series of maps with a FOV of 8″ × 8″ centred on the magnetic flux concentration showing several calculated quantities from the Ca II spectra. First row: Bisector velocity at 70% of the line depth of the Ca II at 8542.1 Å line core. The maps include zoomed views (1.5″ × 1.5″) of the magnetic flux concentration where two points of interest (POIs) are indicated (POI 1 black ×-sign and POI 2 black +-sign). Red contours (drain phase) and blue contours (upward-flow phase) mark the areas of similar profiles of the POI 1 shown in Fig. 7. Second row: Bisector velocity at 40% of the line depth of the Ca II at 8542.1 Å line core. Third row: Normalised intensity of the core of the Ca II line at 8542.1 Å in a logarithmic scale. Contours mark regions of intense (> 2.5σp) TCP of the photospheric Fe I line at 6173.3 Å (orange contours correspond to negative magnetic flux concentrations and light green contours correspond to positive magnetic flux concentrations). Fourth row: K-index defined in Table 1 in logarithmic scale including contours of intensity excess (> 0.2Ic) of the K2V band (red) and the intensity excess of the K2R band (blue). Fifth row: Emission strength defined in Table 1 in logarithmic scale. Sixth row: K2 asymmetry defined in Table 1 in percentages. Several maps include a central black contour to show the location, scale, and evolution of the MBP area. An animation is available online.
Current usage metrics show cumulative count of Article Views (full-text article views including HTML views, PDF and ePub downloads, according to the available data) and Abstracts Views on Vision4Press platform.
Data correspond to usage on the plateform after 2015. The current usage metrics is available 48-96 hours after online publication and is updated daily on week days.
Initial download of the metrics may take a while.