Fig. 4.
Download original image
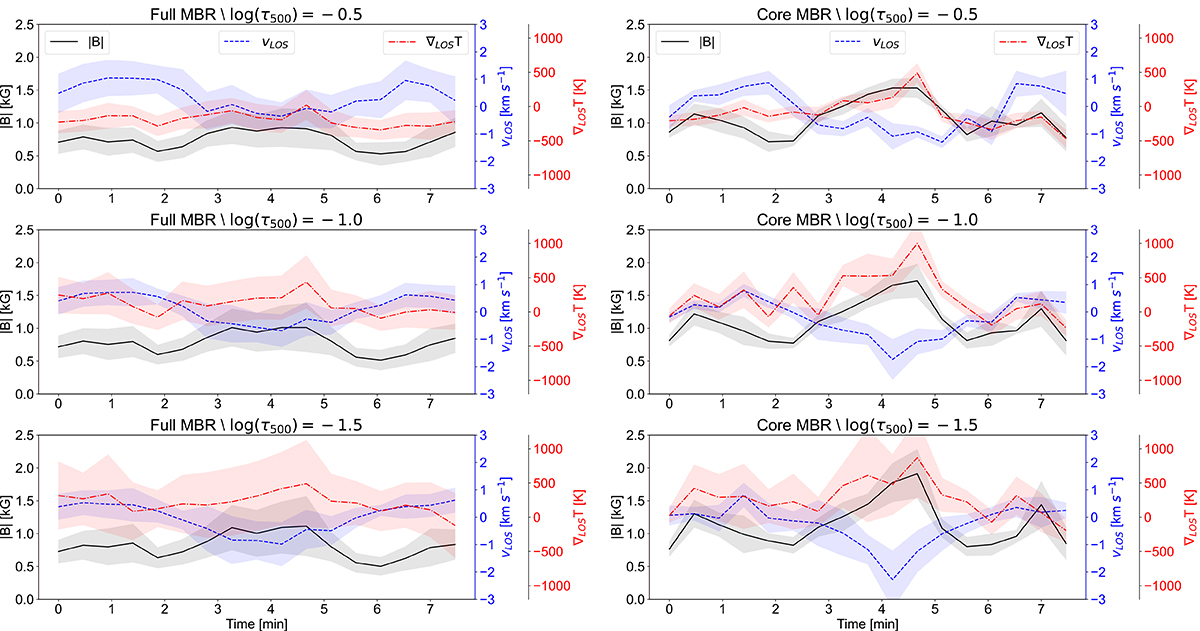
Temporal evolution of the magnetic field strength |B| (solid black lines), LOS velocity vLOS (dashed blue lines) and temperature LOS changes ∇LOST (dot-dashed red lines) at three different log τ500 values estimated from SIR inversions of the Fe I 617.3 nm profiles. First column: Results from the spatial average of the full area of the MBP (region marked by the purple contour in the first column of Fig. 2). Second column: Results from the spatial average of the MBP core (region marked by the black contour in the first column of Fig. 2). The shaded areas represent the standard deviation as a statistical error for each curve. The legends shown in the first row of plots apply to all plots.
Current usage metrics show cumulative count of Article Views (full-text article views including HTML views, PDF and ePub downloads, according to the available data) and Abstracts Views on Vision4Press platform.
Data correspond to usage on the plateform after 2015. The current usage metrics is available 48-96 hours after online publication and is updated daily on week days.
Initial download of the metrics may take a while.