Fig. A.1.
Download original image
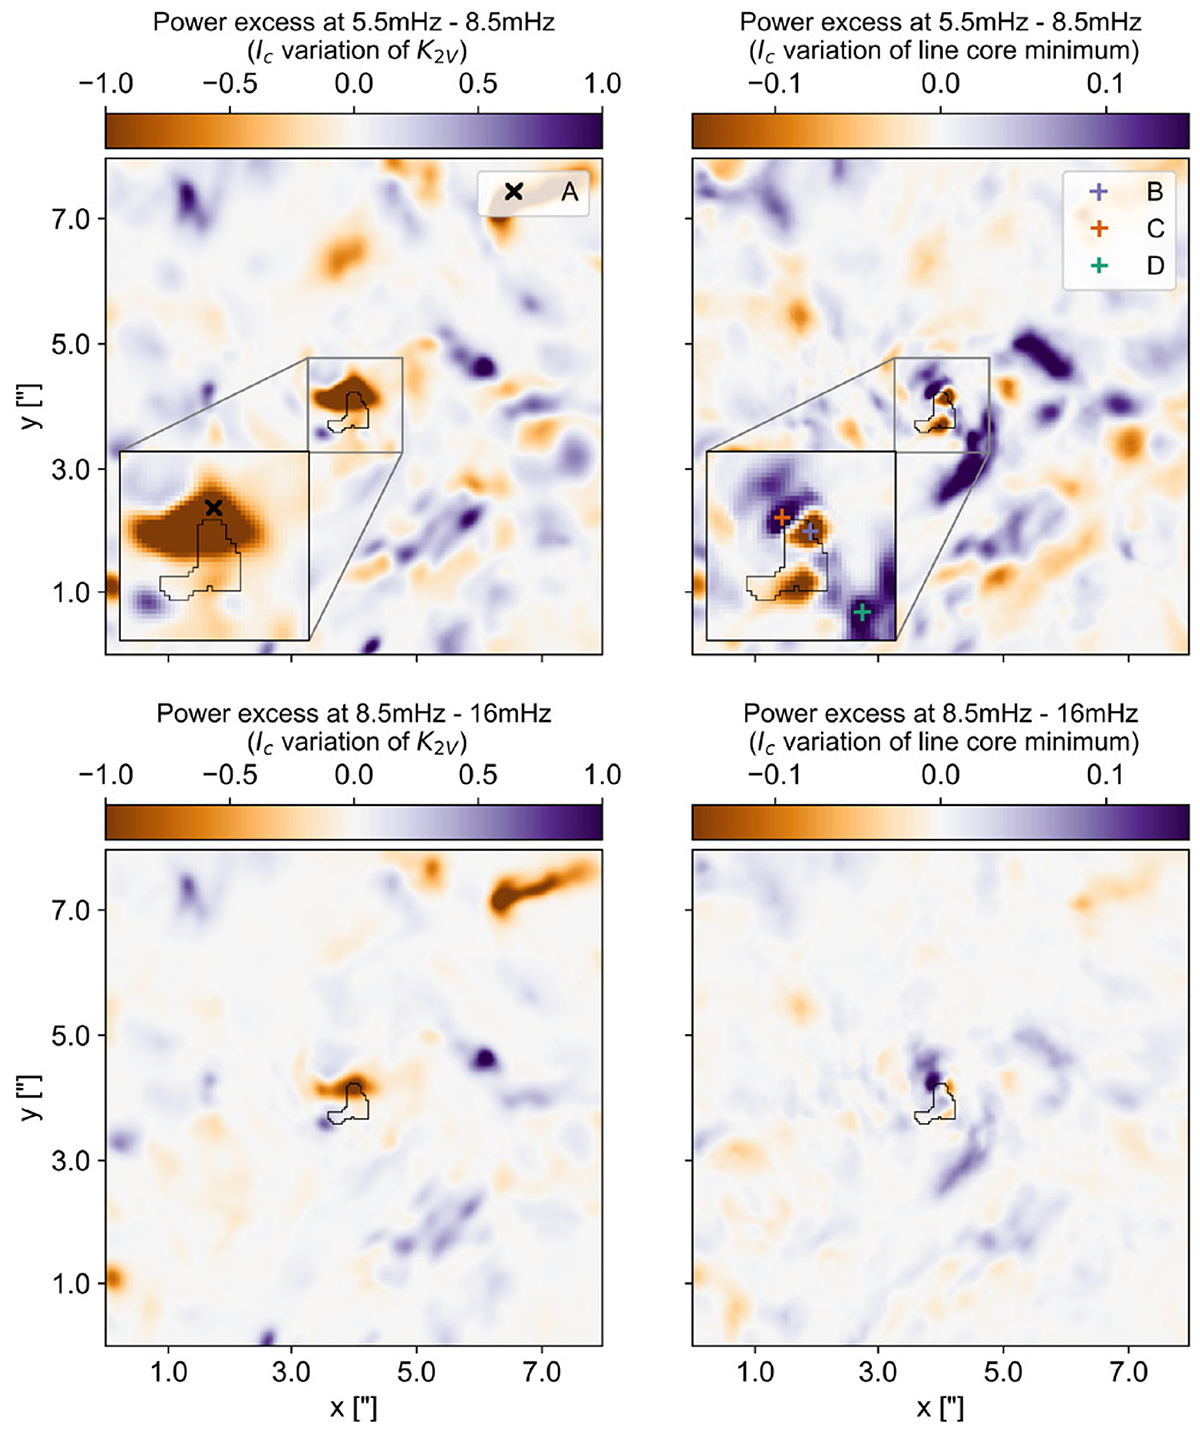
Wave power excess in the medium-frequency range (5.5 mHz to 8.5 mHz, top row) and in the high-frequency range (8.5 mHz to 16 mHz, bottom row) of the intensity variation in the K2V band (left column) and line-core minimum (right column). Positive excess corresponds to larger values of power one minute after t = 3.27 min and negative excess corresponds to larger values of power one minute before t = 3.27 min. The central black contour shows the location and scales of the MBP at t = 3.73 min.
Current usage metrics show cumulative count of Article Views (full-text article views including HTML views, PDF and ePub downloads, according to the available data) and Abstracts Views on Vision4Press platform.
Data correspond to usage on the plateform after 2015. The current usage metrics is available 48-96 hours after online publication and is updated daily on week days.
Initial download of the metrics may take a while.