Fig. 11.
Download original image
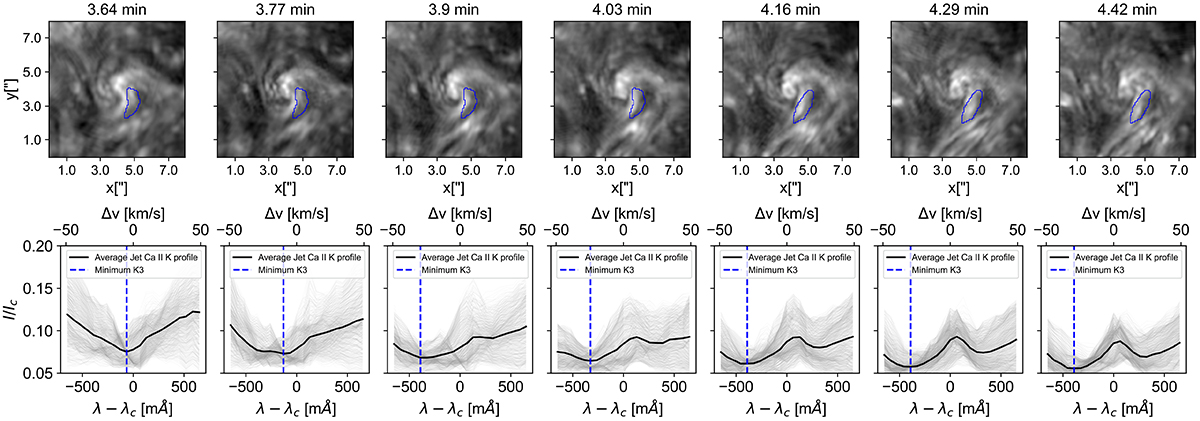
Full cadence observation of the Ca II K spectra in the line core during the detection of the chromospheric jet between t = 3.64 min to t = 4.42 min. Top row: Maps of the intensity in the fixed wavelength at 3933.7 Å. Blue contours mark the location of the jet according to the Hα observation. Bottom row: The corresponding spectral profiles in each time step of pixels within the jet (grey profiles) and their mean profile (black profile). The blue, vertical, dashed line marks the minimum value of the line core.
Current usage metrics show cumulative count of Article Views (full-text article views including HTML views, PDF and ePub downloads, according to the available data) and Abstracts Views on Vision4Press platform.
Data correspond to usage on the plateform after 2015. The current usage metrics is available 48-96 hours after online publication and is updated daily on week days.
Initial download of the metrics may take a while.