Fig. 2.
Download original image
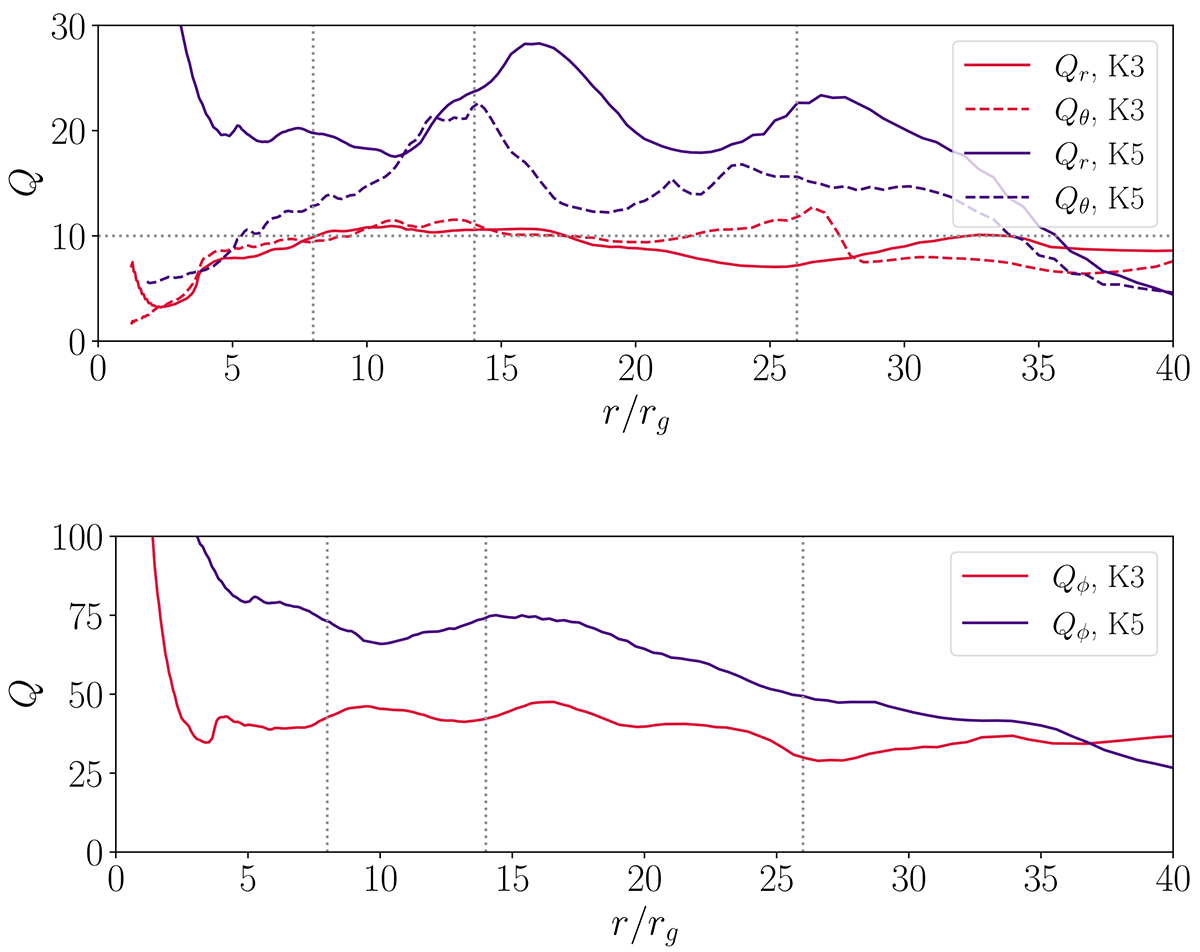
Time-averaged profile of quality factors Qr, Qθ, Qϕ in the equatorial plane for the thick disk models with an initial β = 10 (model Q5) and β = 100 (model K3). The vertical dotted lines show the positions of the inner radius, the pressure maximum, and the outer radius of the initial torus. The horizontal line shows the level Q = 10.
Current usage metrics show cumulative count of Article Views (full-text article views including HTML views, PDF and ePub downloads, according to the available data) and Abstracts Views on Vision4Press platform.
Data correspond to usage on the plateform after 2015. The current usage metrics is available 48-96 hours after online publication and is updated daily on week days.
Initial download of the metrics may take a while.