Fig. A.3.
Download original image
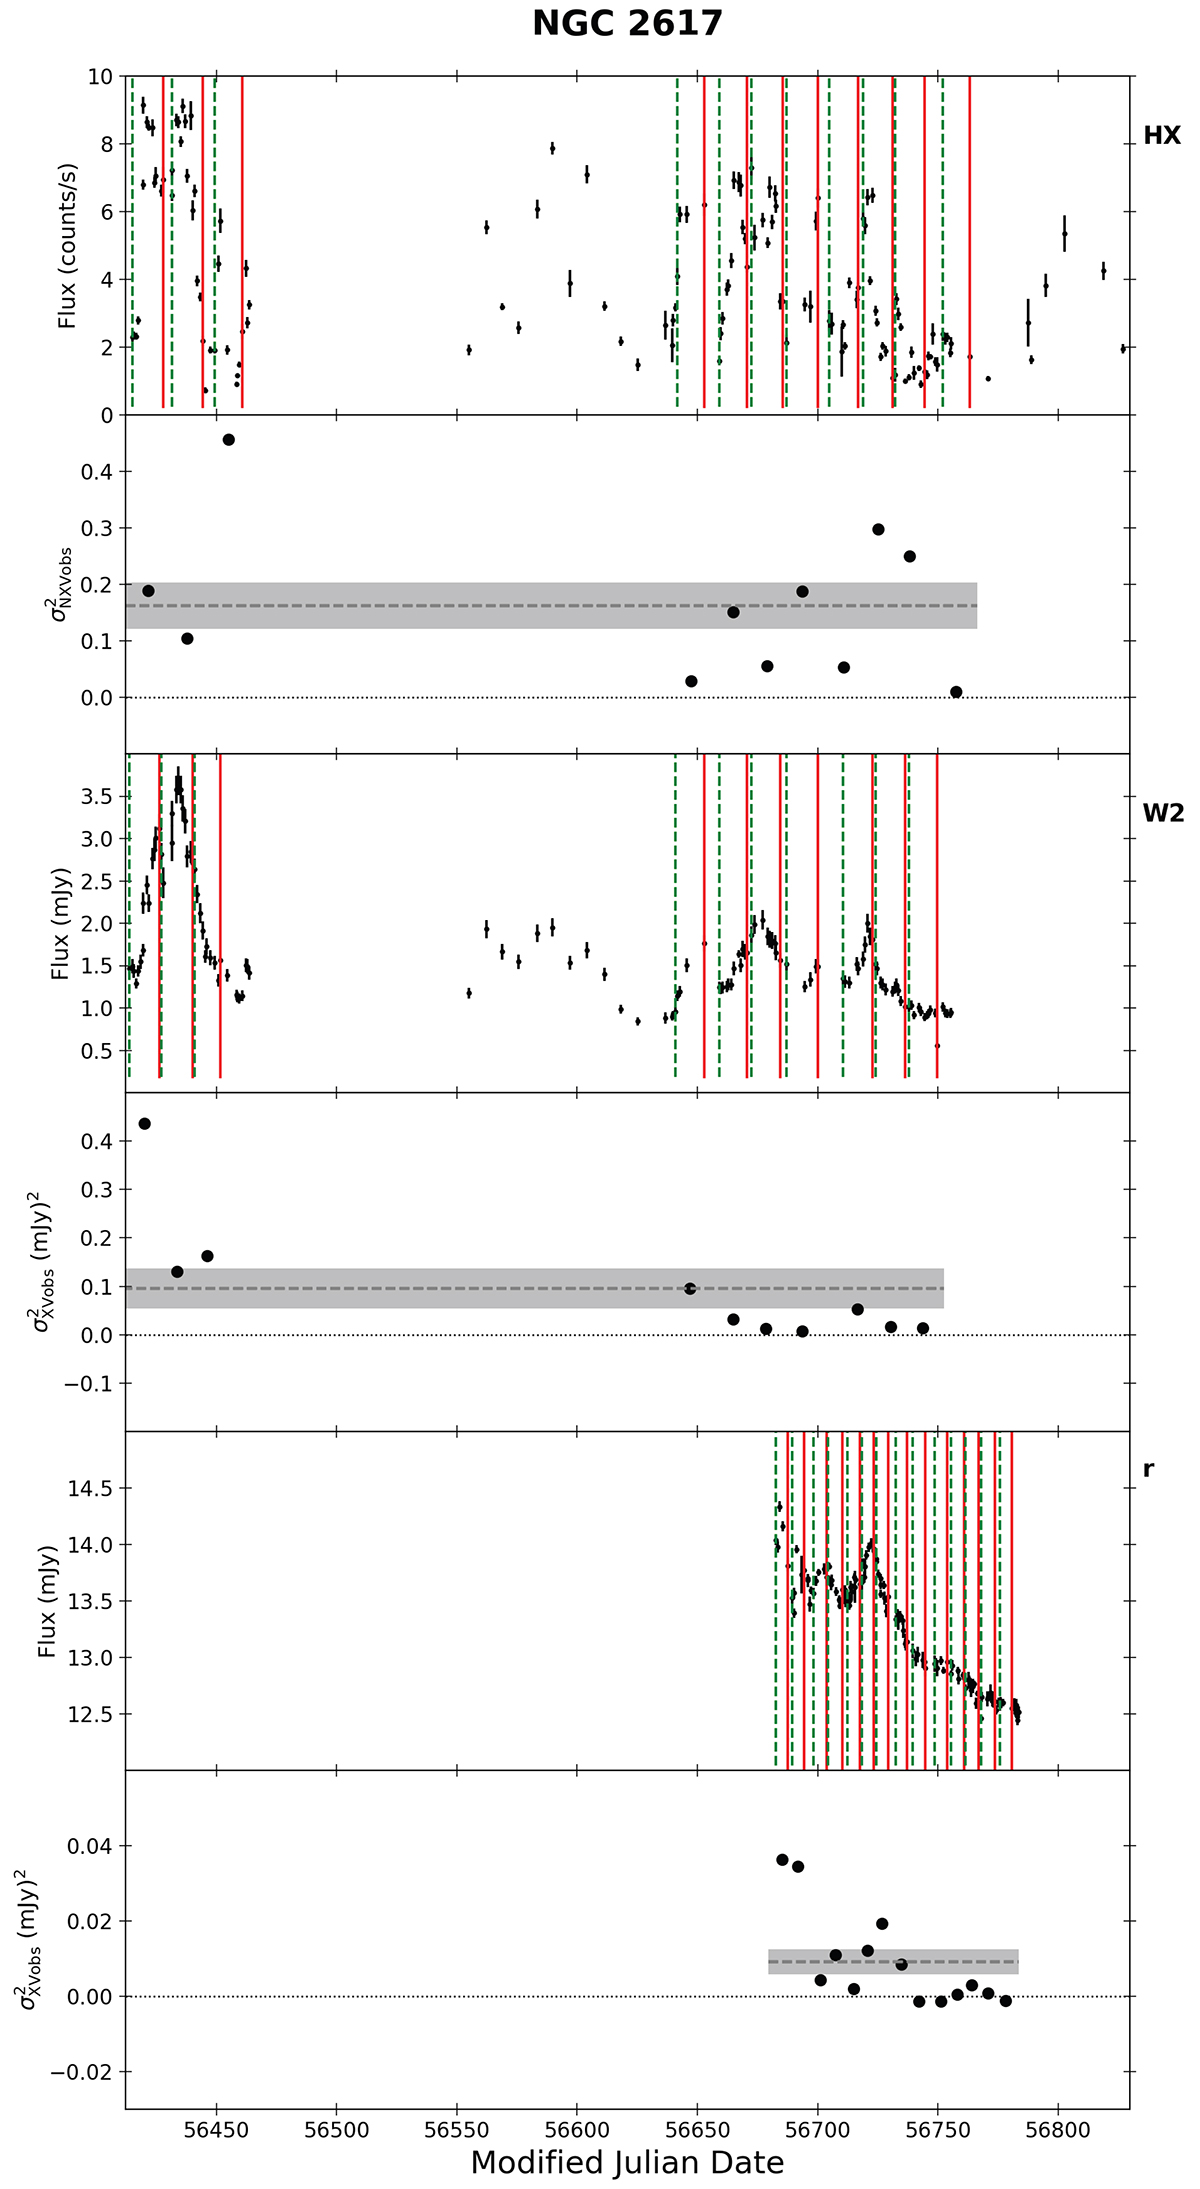
Same as in Fig. A.1 for NGC 2617 (data taken from F18). To extend the spectral coverage of the variance spectra, we also considered light curves in the r, i, and z−bands for this source (data from the same source). For this reason, we also plot the r−band light curve in this figure. The segments we used to compute the excess variance in the i and z−band light curves are very similar to the ones indicated in the r−band light curve.
Current usage metrics show cumulative count of Article Views (full-text article views including HTML views, PDF and ePub downloads, according to the available data) and Abstracts Views on Vision4Press platform.
Data correspond to usage on the plateform after 2015. The current usage metrics is available 48-96 hours after online publication and is updated daily on week days.
Initial download of the metrics may take a while.