Open Access
Fig. A.2.
Download original image
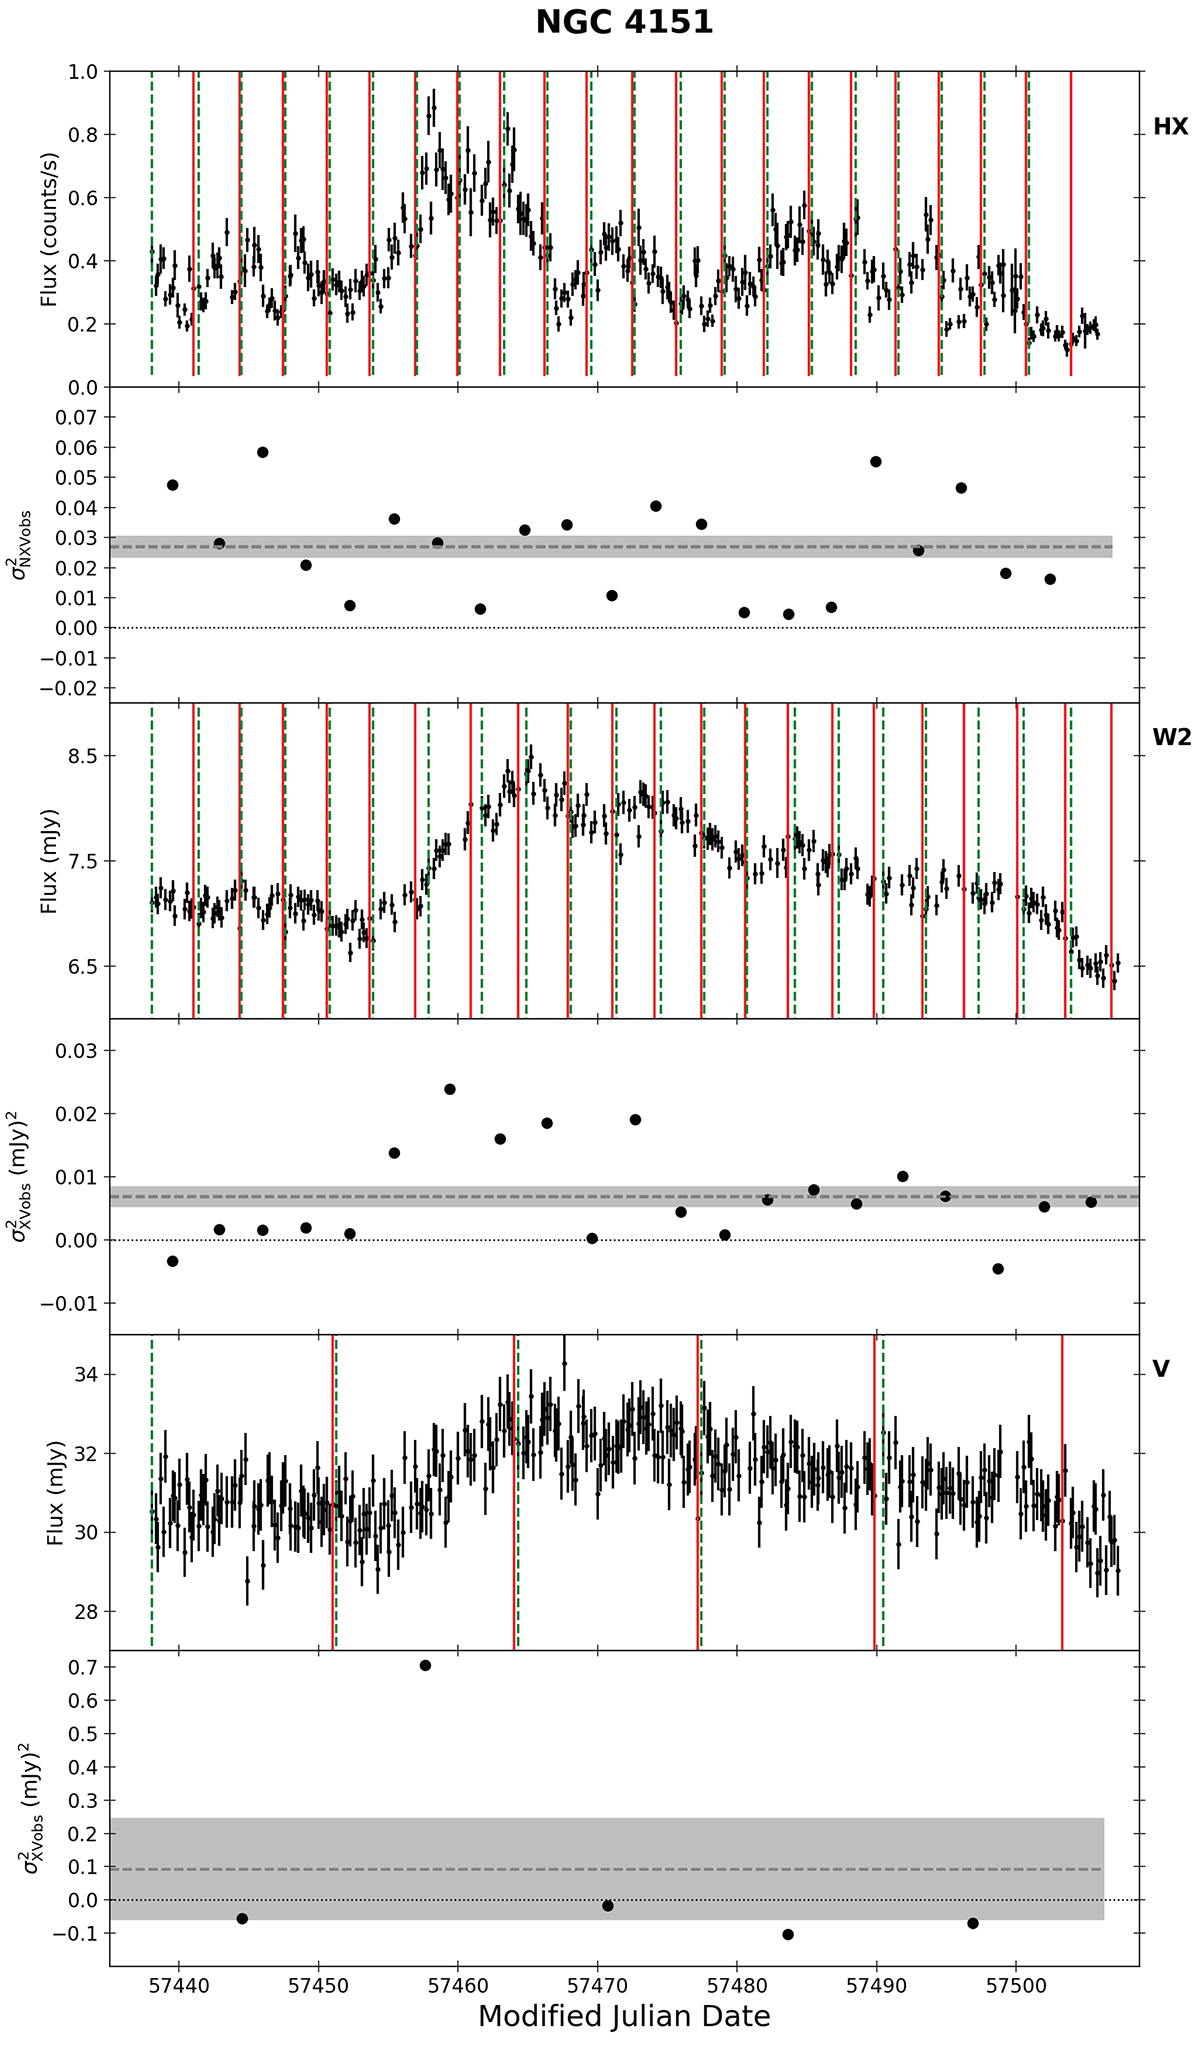
Same as in Fig. A.1 for NGC 4151 (data are taken from E17). In this case, we plot the Swift V band light curve as well, as the width of the segments in this light curve is different than the width of the segments in the Swift W2 and the other band light curves.
Current usage metrics show cumulative count of Article Views (full-text article views including HTML views, PDF and ePub downloads, according to the available data) and Abstracts Views on Vision4Press platform.
Data correspond to usage on the plateform after 2015. The current usage metrics is available 48-96 hours after online publication and is updated daily on week days.
Initial download of the metrics may take a while.