Fig. A.1.
Download original image
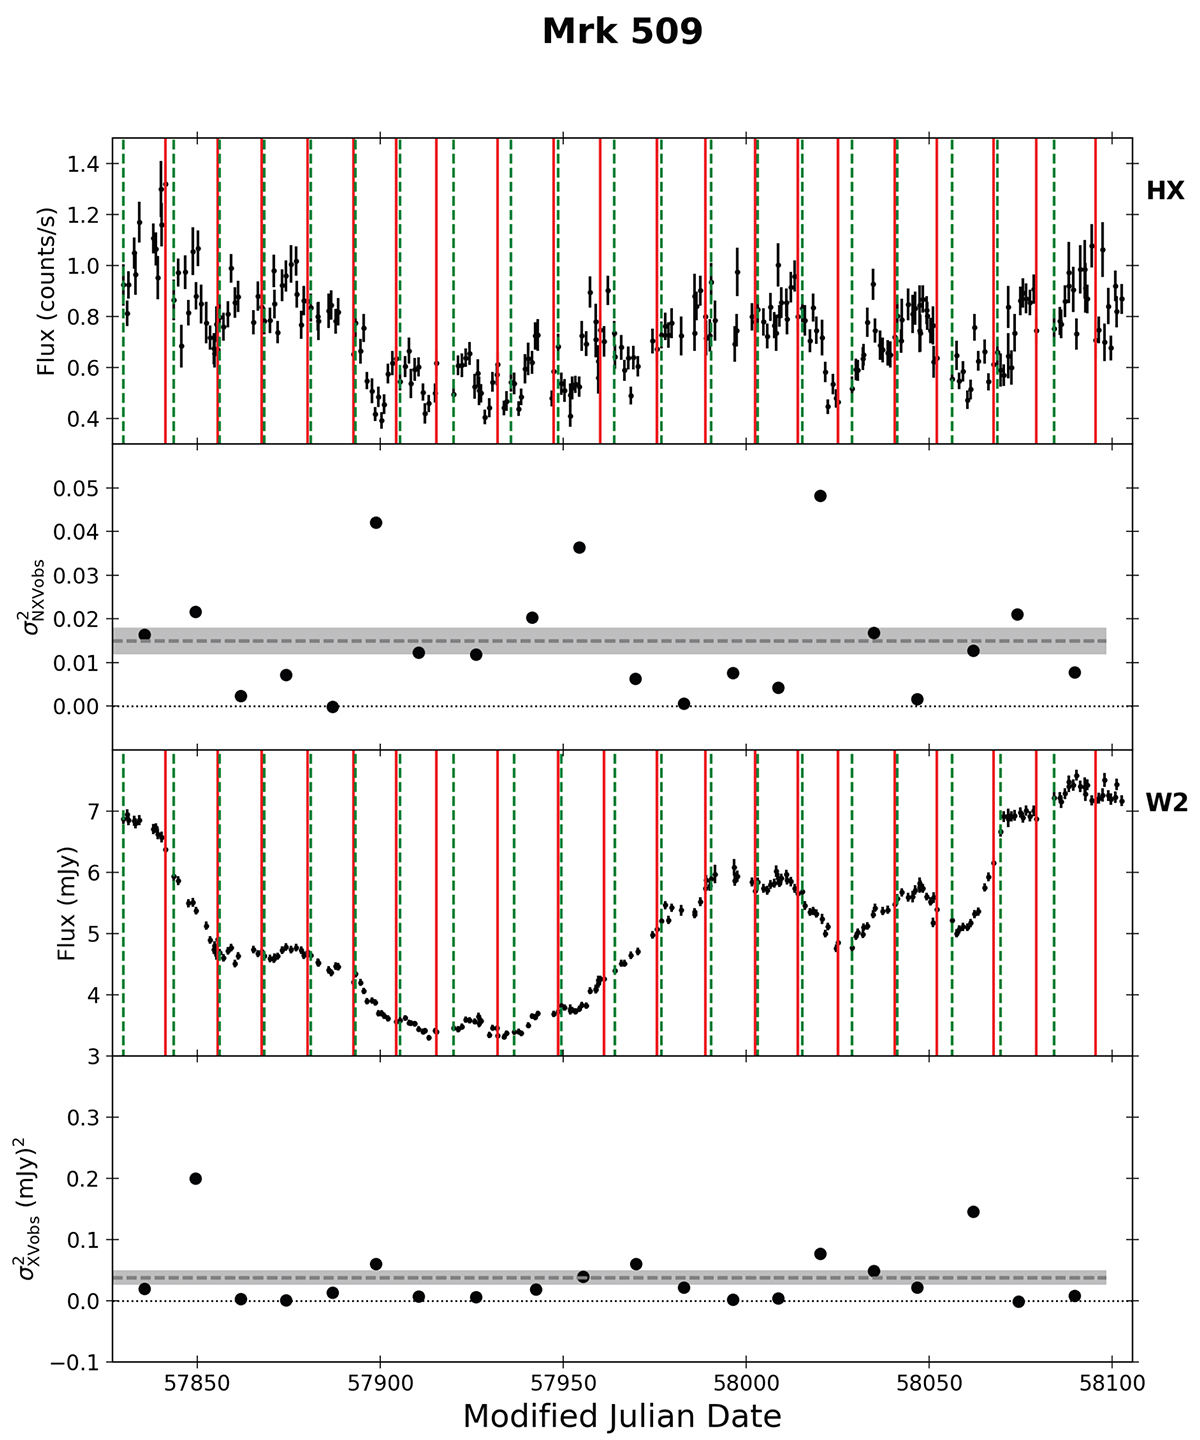
X-ray and Swift W2 light curves of Mrk 509 (data taken from E19). The green dashed and red solid lines indicate the starting and ending points of the light curve segments that we used to compute σNXVobs2 and σXVobs2. The segments we used to compute the excess variance in the other optical bands are very similar to the ones indicated in the panel which shows the W2 light curve. The black points in the bottom panels of each plot show the variance measurements of each segment. The grey dashed lines and the grey area show the mean variance and its error, respectively. We draw black dotted lines at σNXVobs2 = 0 and σXVobs2 = 0.
Current usage metrics show cumulative count of Article Views (full-text article views including HTML views, PDF and ePub downloads, according to the available data) and Abstracts Views on Vision4Press platform.
Data correspond to usage on the plateform after 2015. The current usage metrics is available 48-96 hours after online publication and is updated daily on week days.
Initial download of the metrics may take a while.