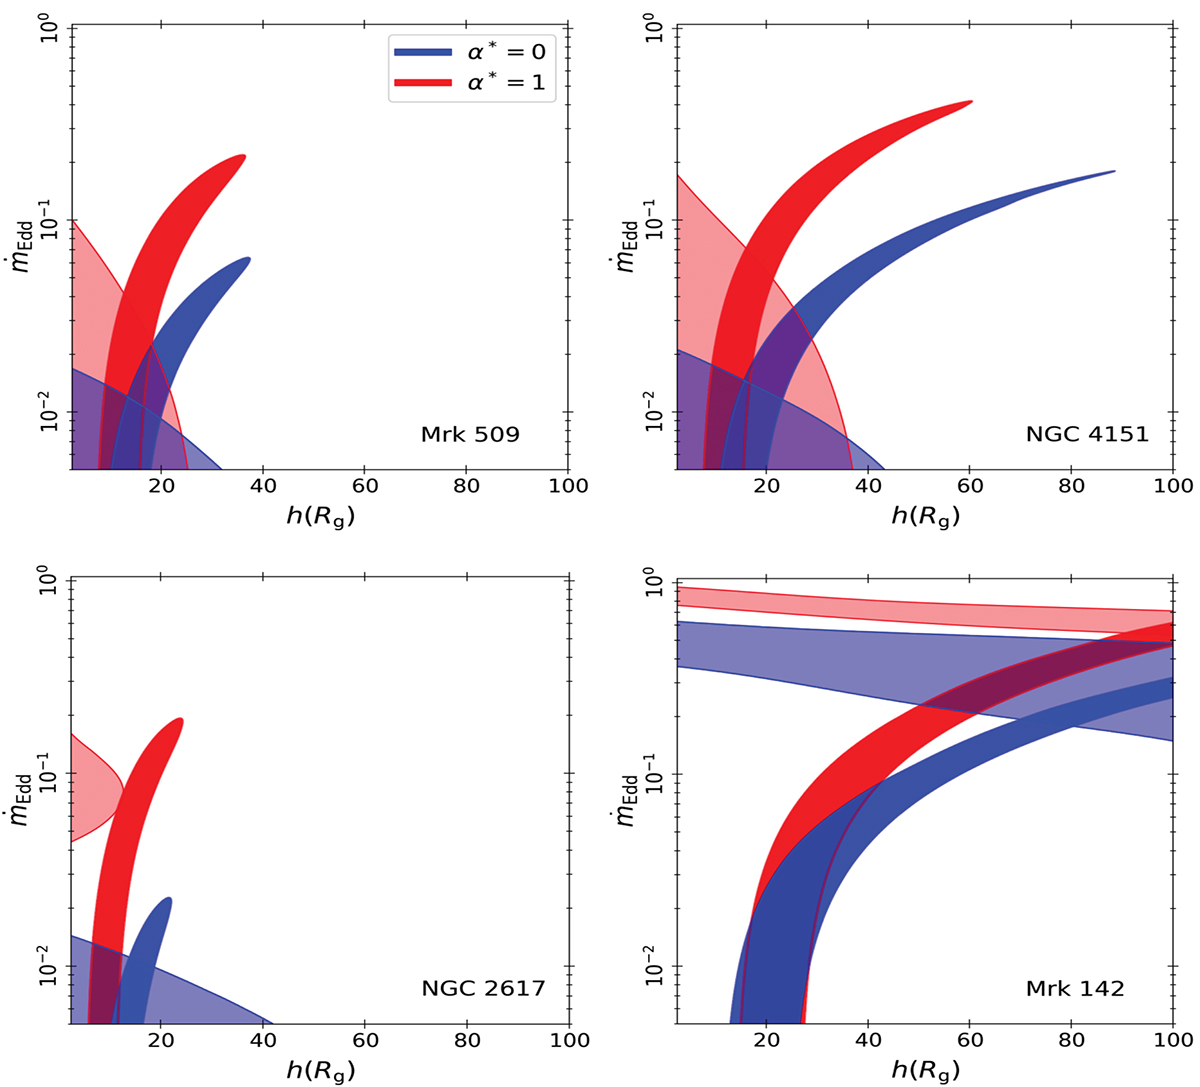
Fig. 5.
Download original image
1σ confidence regions of (h, ṁEdd) for each source. Blue and red regions indicate the confidence regions for α* = 0 and 1, respectively. Similarly, lighter blue and red shaded areas show the 1σ confidence regions as determined by K21b when fitting the time-lags, for α* = 0 and 1, respectively. In the case of Mrk 142 (lower right panel), the lighter shaded areas indicate the 1σ (h, ṁEdd) confidence regions obtained from our best fit to the time-lags assuming MBH = 4 × 10⁶ M⊙ (see Sect. 6.6).
Current usage metrics show cumulative count of Article Views (full-text article views including HTML views, PDF and ePub downloads, according to the available data) and Abstracts Views on Vision4Press platform.
Data correspond to usage on the plateform after 2015. The current usage metrics is available 48-96 hours after online publication and is updated daily on week days.
Initial download of the metrics may take a while.