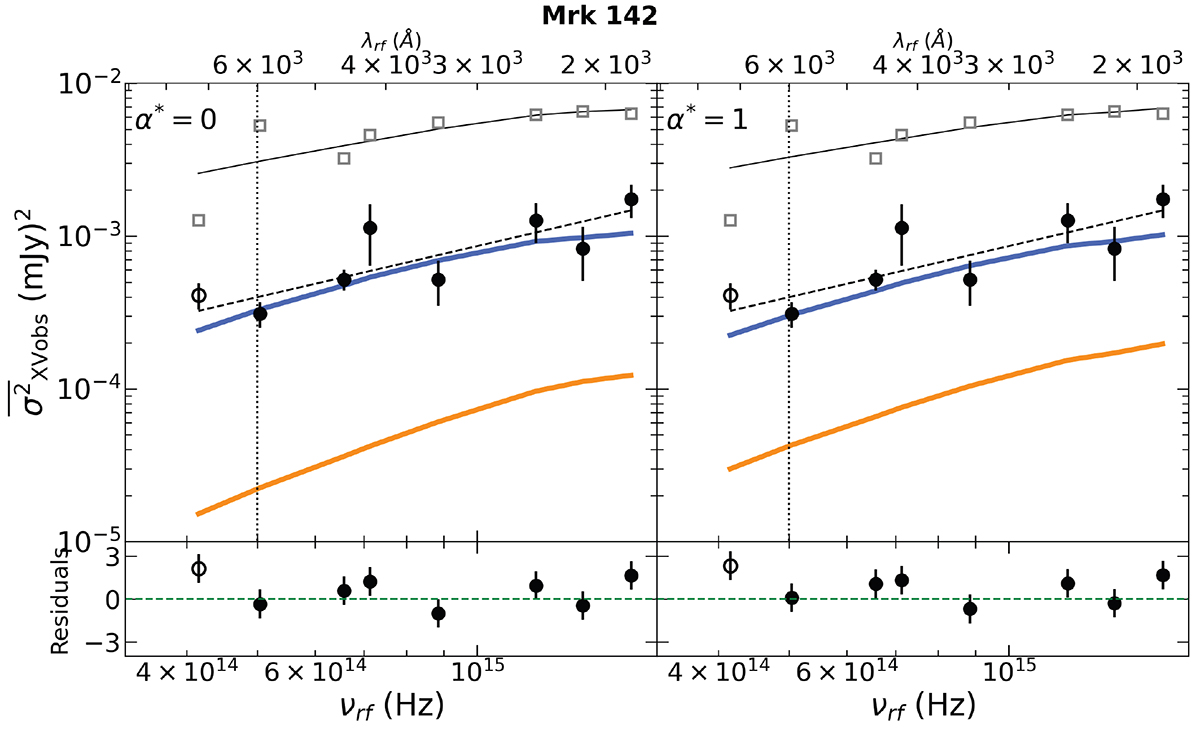
Fig. 4.
Download original image
Same as in Fig. 1 for Mrk 142. The variance measurements have been calculated for Tmax = 6 days. Solid orange lines show the model predictions when assuming MBH = 2 × 10⁶ and the parameters in K21b (see Sect. 6.6), while the blue lines show the best-fit model for MBH = 4 × 10⁶ and the parameters listed in Tables 1 and 3. The slope of the best-fit dashed black line is b = 1.1 ± 0.2. Grey points and solid black line as in Fig. 1.
Current usage metrics show cumulative count of Article Views (full-text article views including HTML views, PDF and ePub downloads, according to the available data) and Abstracts Views on Vision4Press platform.
Data correspond to usage on the plateform after 2015. The current usage metrics is available 48-96 hours after online publication and is updated daily on week days.
Initial download of the metrics may take a while.