Fig. 3.
Download original image
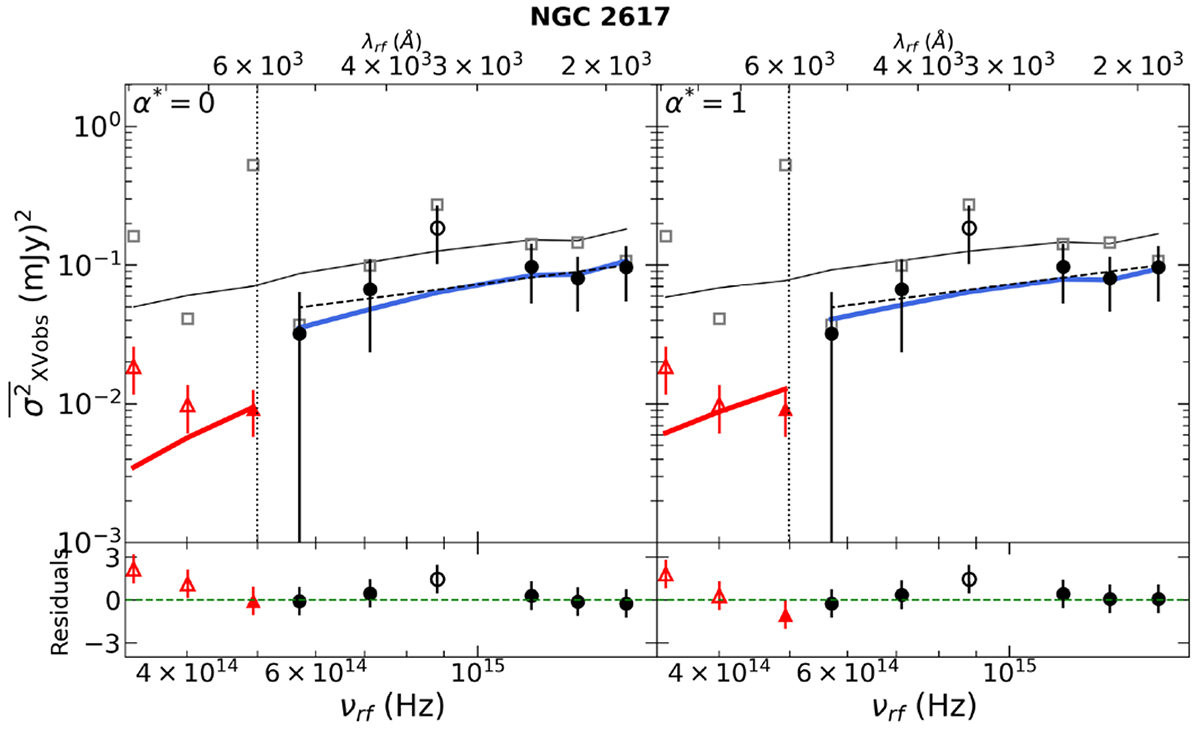
Same as in Fig. 1 for NGC 2617. We show ![]() with Tmax = 6 and 13 days with red triangle and black circle markers, respectively. We show the best-fit model variance for Tmax = 6 and 13 days with red and blue lines, respectively. The M2 variance is lower than the adjacent W1 and W2 variances for the same reason explained in Fig. 1. The slope of the best-fit dashed black line is b = 0.7 ± 0.8. The vertical dashed line indicates λ = 6000 Å. Grey points and solid black line as in Fig. 1.
with Tmax = 6 and 13 days with red triangle and black circle markers, respectively. We show the best-fit model variance for Tmax = 6 and 13 days with red and blue lines, respectively. The M2 variance is lower than the adjacent W1 and W2 variances for the same reason explained in Fig. 1. The slope of the best-fit dashed black line is b = 0.7 ± 0.8. The vertical dashed line indicates λ = 6000 Å. Grey points and solid black line as in Fig. 1.
Current usage metrics show cumulative count of Article Views (full-text article views including HTML views, PDF and ePub downloads, according to the available data) and Abstracts Views on Vision4Press platform.
Data correspond to usage on the plateform after 2015. The current usage metrics is available 48-96 hours after online publication and is updated daily on week days.
Initial download of the metrics may take a while.