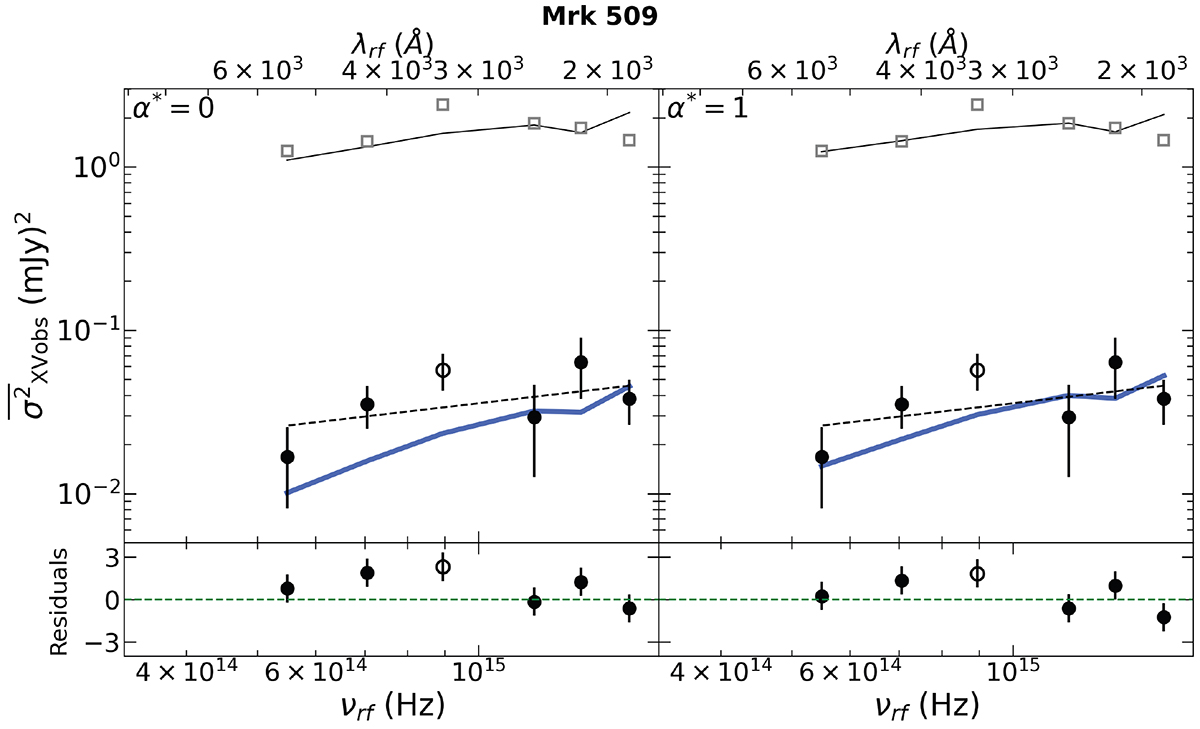
Fig. 1.
Download original image
Mrk 509 variance spectrum (i.e. the variance in units of (mJy)2 plotted as a function of photon frequency). Black points show the observed variance measurements calculated from light curve segments of duration, Tmax = 12 days (listed in Table 2). Open circles indicate data points excluded during the model fits. The black dashed line shows the best linear fit (in log-log space) to the data. The best-fit slope is b = 0.5 ± 0.4. The blue lines show the X-ray reverberation best-fit models for α* = 0 (left panel) and α* = 1 (right panel). The model’s M2 variance is lower than the adjacent W1 and W2 variances because of the ∼2200 Å feature in the Milky Way’s extinction law as determined by Cardelli et al. (1989). The bottom panels show the best-fit residuals, i.e. the observed variance and best fit model variance over the observed variance error, in the case of the X-ray reverberation best-fit models (blue lines). Grey squares on the top show the measured excess variance calculated using the full light curves, while the solid black line shows the best-fit model prediction for these measurements (see Sect. 6.4 for more details).
Current usage metrics show cumulative count of Article Views (full-text article views including HTML views, PDF and ePub downloads, according to the available data) and Abstracts Views on Vision4Press platform.
Data correspond to usage on the plateform after 2015. The current usage metrics is available 48-96 hours after online publication and is updated daily on week days.
Initial download of the metrics may take a while.