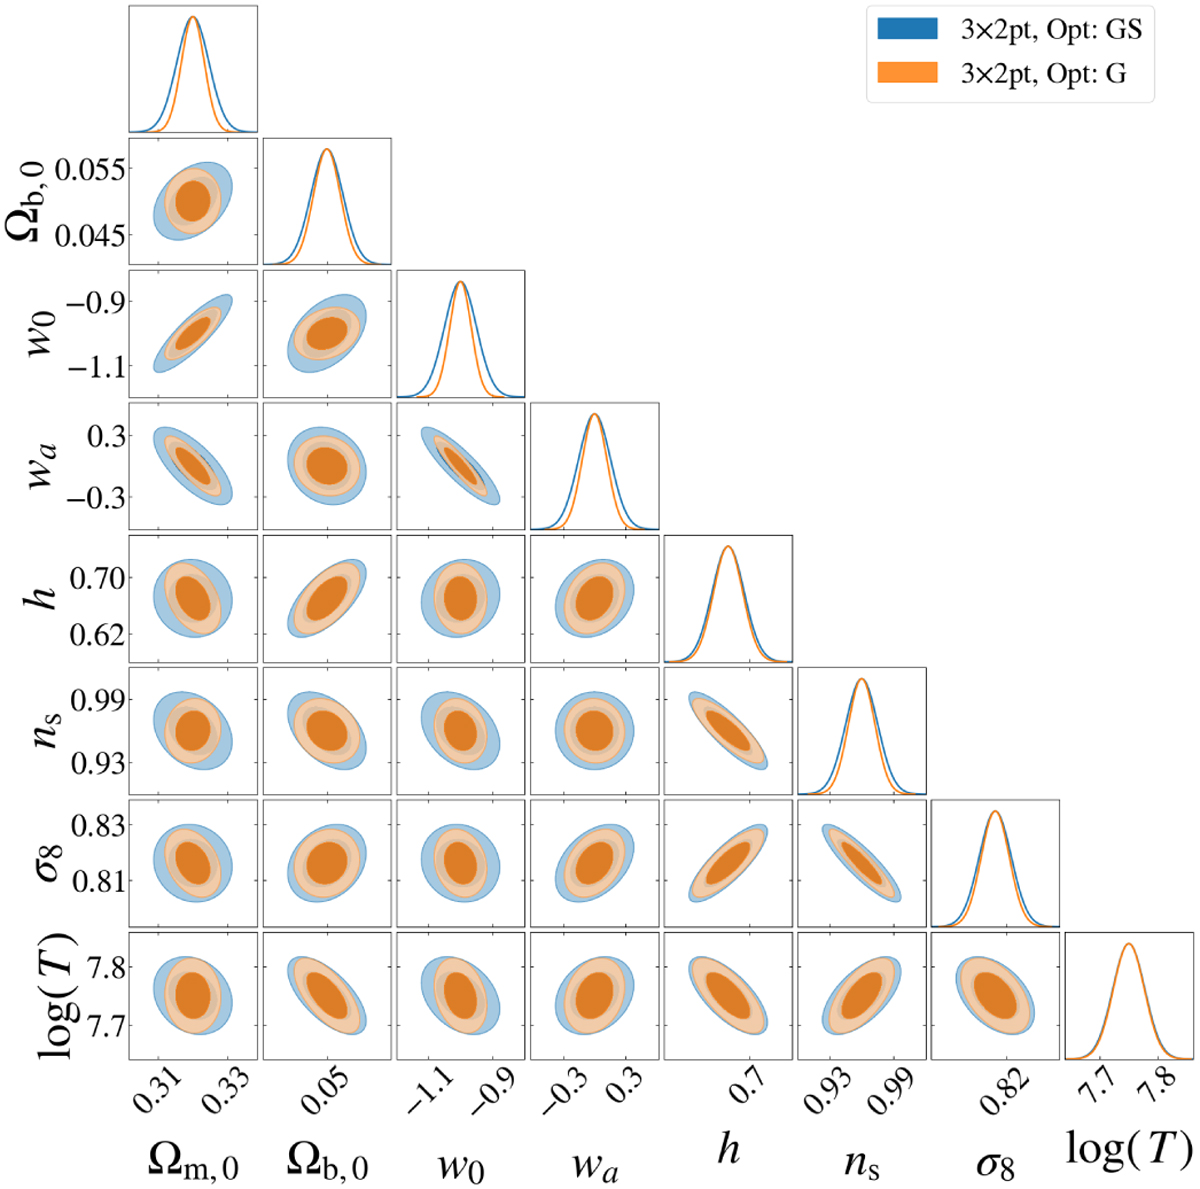
Fig. 7
Download original image
Contour plot for the G and GS constraints, considering the full 3×2pt analysis in the optimistic case, in the reference scenario. The two shaded regions of the ellipses represent the 1 and 2σ contours. For clarity, the nuisance parameters are shown separately in Fig. 8 and the log10(TAGN/K) parameter name has been shortened to log(T).
Current usage metrics show cumulative count of Article Views (full-text article views including HTML views, PDF and ePub downloads, according to the available data) and Abstracts Views on Vision4Press platform.
Data correspond to usage on the plateform after 2015. The current usage metrics is available 48-96 hours after online publication and is updated daily on week days.
Initial download of the metrics may take a while.