Fig. 2
Download original image
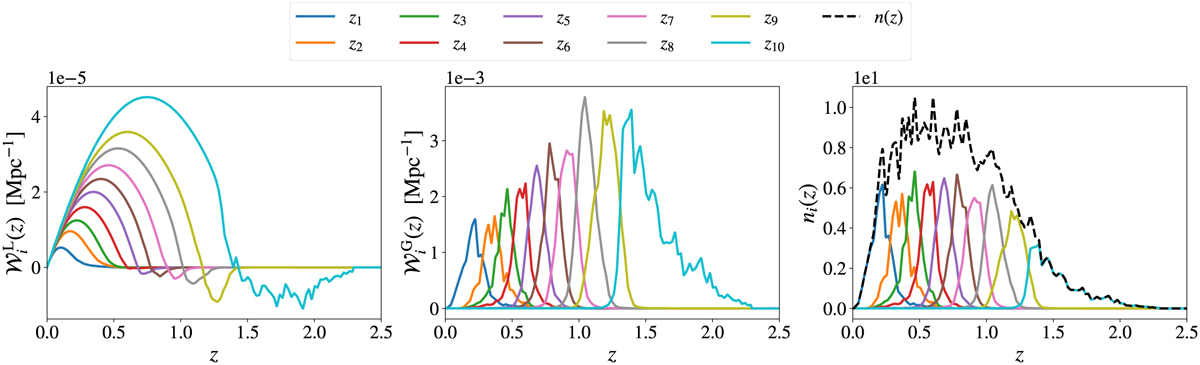
Kernels and galaxy distribution considered in this work. The first two plots show the kernels, or weight for the two photometric probes. The analytic expressions for these are, respectively, Eqs. (18) (left, WL) and (21) (right, GCph). At high redshifts, the IA term dominates over the shear term in the lensing kernels, making them negative. The rightmost plot shows the redshift distribution per redshift bin for the sources (and lenses), as well as their sum, obtained from the Flagship 1 simulation as described in Sect. 3.1.
Current usage metrics show cumulative count of Article Views (full-text article views including HTML views, PDF and ePub downloads, according to the available data) and Abstracts Views on Vision4Press platform.
Data correspond to usage on the plateform after 2015. The current usage metrics is available 48-96 hours after online publication and is updated daily on week days.
Initial download of the metrics may take a while.