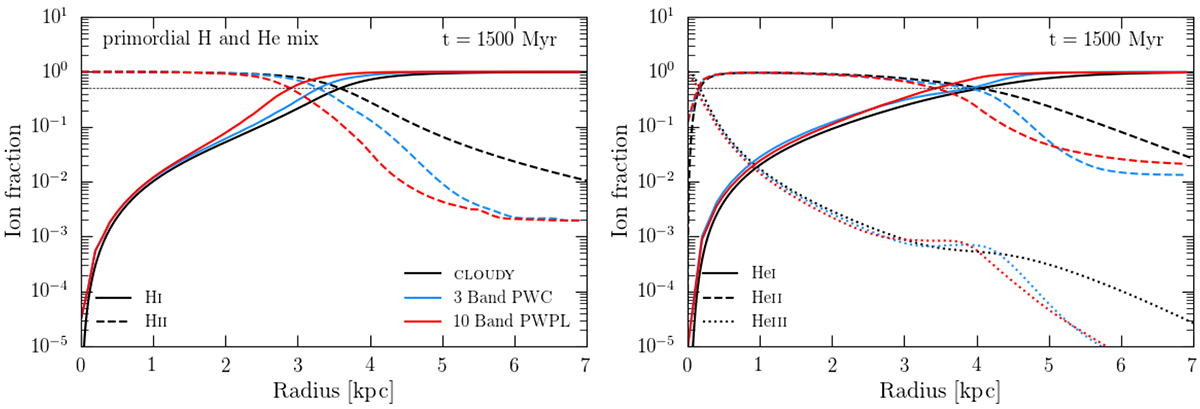
Fig. 8.
Download original image
Expanding HII region in a primodial mixture of hydrogen and helium environment with nH = 10−3 cm−3 and an initial temperature of 100 K. The hydrogen ion fractions (HI solid and HII dashed lines) after t = 1500 Myr is shown in the left panel. The right panel shows the helium ion fractions (HeI solid, HeII dashed, and HeIII dotted lines) after t = 1500 Myr. The thin dashed line represents an ion fraction of 50%.
Current usage metrics show cumulative count of Article Views (full-text article views including HTML views, PDF and ePub downloads, according to the available data) and Abstracts Views on Vision4Press platform.
Data correspond to usage on the plateform after 2015. The current usage metrics is available 48-96 hours after online publication and is updated daily on week days.
Initial download of the metrics may take a while.