Fig. 7.
Download original image
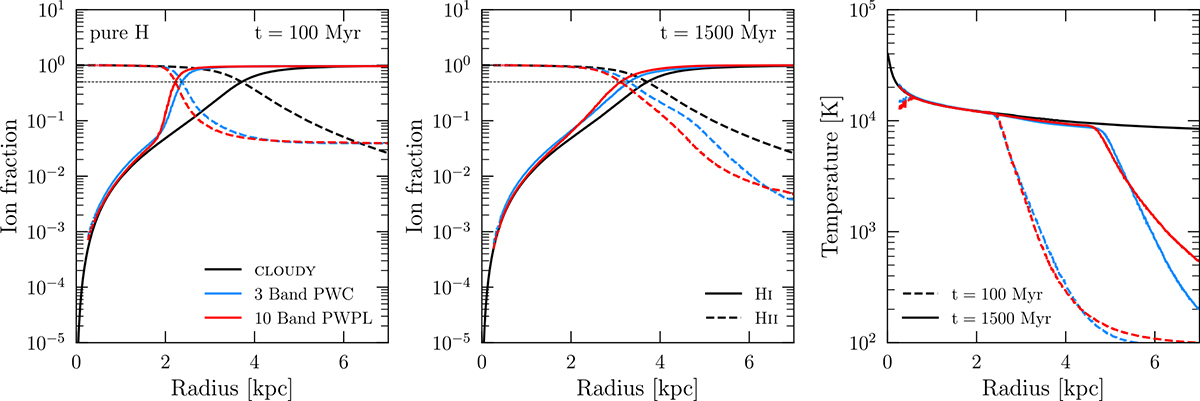
Expanding HII region in a pure hydrogen environment with nH = 10−3 cm−3 and an initial temperature of 100 K. The hydrogen ion fractions (HI solid and HII dashed lines) after t = 100 (1500) Myr is shown in the left (middle) panel. Red lines show the results using the ten-band PWPL, blue lines using the three-band PWC approximation, and the black lines represent the CLOUDY equilibrium solution. The thin dashed line represents an ion fraction of 50%. The right panel shows the temperature profile of the HII region after t = 100 and 1500 Myr as dashed and solid lines, respectively.
Current usage metrics show cumulative count of Article Views (full-text article views including HTML views, PDF and ePub downloads, according to the available data) and Abstracts Views on Vision4Press platform.
Data correspond to usage on the plateform after 2015. The current usage metrics is available 48-96 hours after online publication and is updated daily on week days.
Initial download of the metrics may take a while.