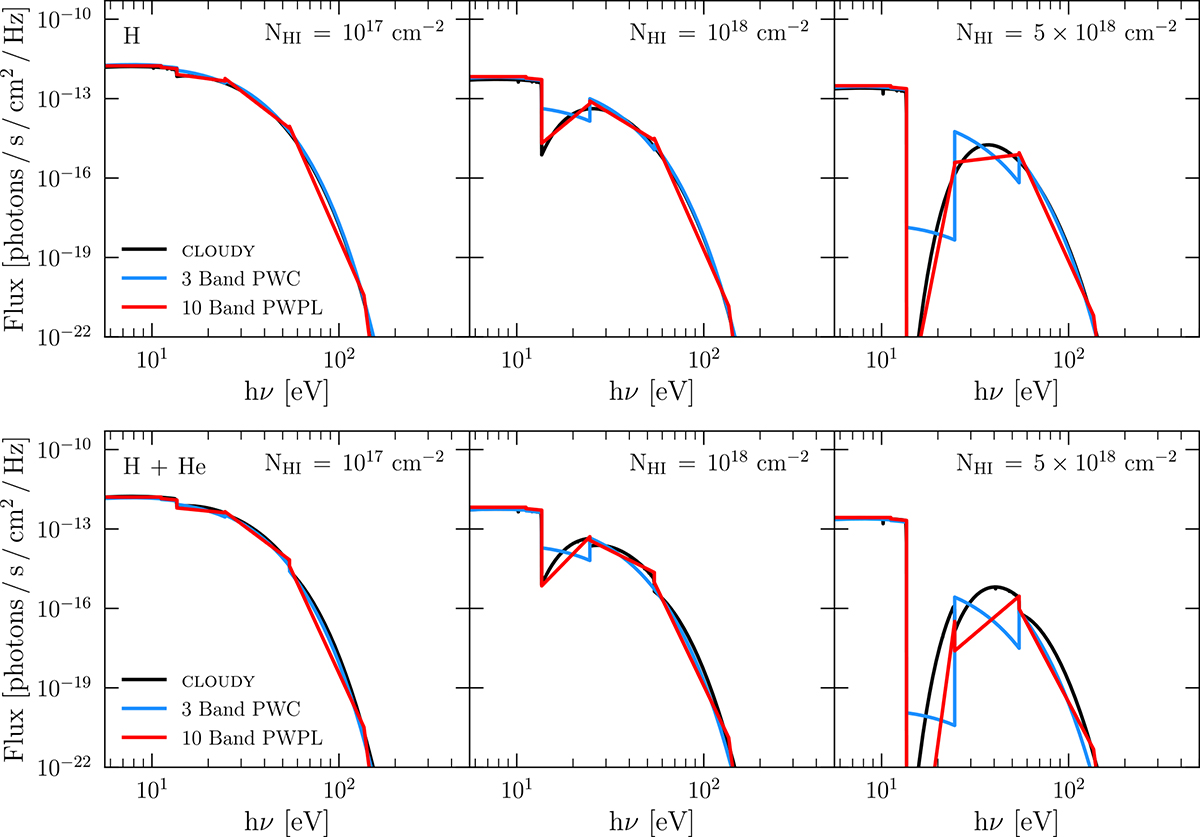
Fig. 6.
Download original image
Reconstructed radiation field after t = 1500 Myr, at column densities of NHI = 1017, 1018, and 5 × 1018 cm−2 (from left to right) from the source, for the pure hydrogen (top) and primordial hydrogen and helium mixture (bottom) case. The black line denotes the CLOUDY reference runs, the red lines show the reconstructed spectrum using the PWPL approximation and the blue line represents the classic three-band PWC approach. For illustrative purposes, we represent the spectral shape of the three-band PWC case as scaled intervals of the initial black-body spectrum, while in practice it is treated as a delta function at the effective frequency of each band.
Current usage metrics show cumulative count of Article Views (full-text article views including HTML views, PDF and ePub downloads, according to the available data) and Abstracts Views on Vision4Press platform.
Data correspond to usage on the plateform after 2015. The current usage metrics is available 48-96 hours after online publication and is updated daily on week days.
Initial download of the metrics may take a while.