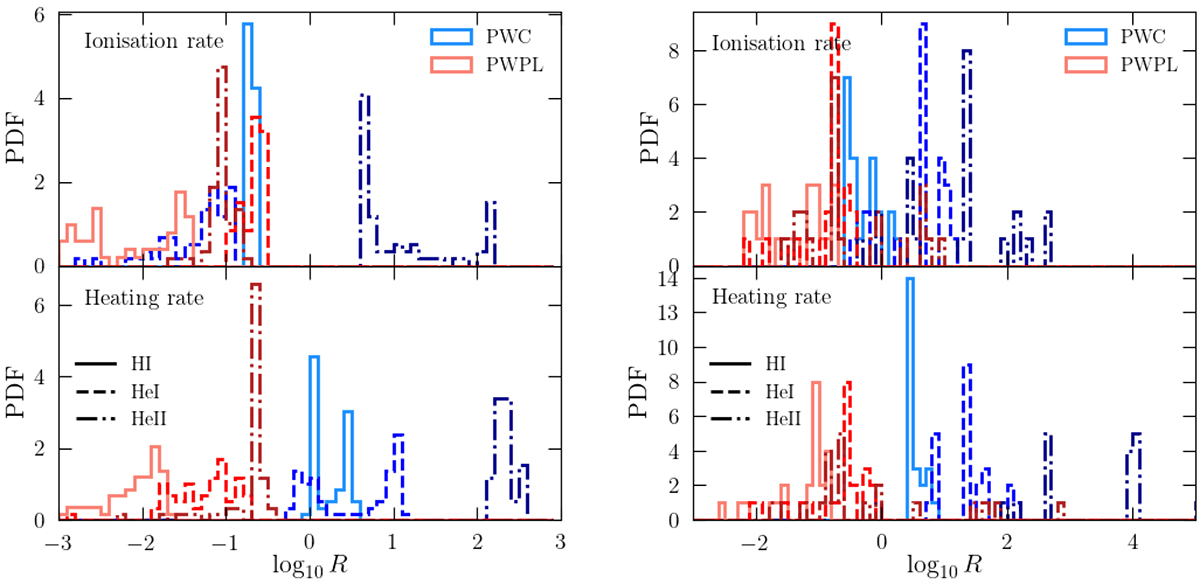
Fig. 5.
Download original image
Relative error distribution for the ionisation (top) and heating (bottom) rates, for the PWPL (reds) and PWC (blues) approximation. The left panel corresponds to the redshift dependent UVB spectrum and the right panel to the age dependent SSP spectrum for population ages below 8 Myr. Different line styles show the error distribution for HI (solid), HeI (dashed), and HeII (dot-dashed). The errors are calculated relative to the numerical integration of Eqs. (1) and (2).
Current usage metrics show cumulative count of Article Views (full-text article views including HTML views, PDF and ePub downloads, according to the available data) and Abstracts Views on Vision4Press platform.
Data correspond to usage on the plateform after 2015. The current usage metrics is available 48-96 hours after online publication and is updated daily on week days.
Initial download of the metrics may take a while.