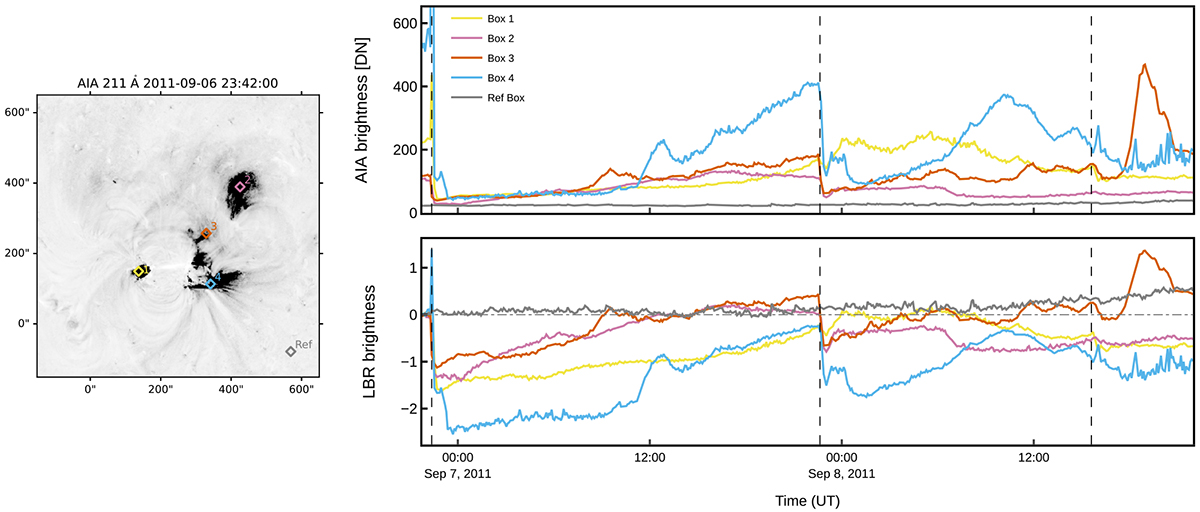
Fig. 7.
Download original image
Locations of the chosen area boxes and comparison of their brightness behavior for September 6, 2011, event. Left panel: SDO/AIA 211 Å logarithmic base ratio images during the impulsive phase of the dimming. Four colored boxes of size 3 × 3 pixels in different dimming regions of interest are over-plotted. The reference box is located in a random quiet Sun region. Right panel: Intensity evolution of the boxes from the original AIA images (top) and LBR images (bottom). The dashed horizontal line marks the pre-event brightness level. The dashed vertical lines indicate the peak time of the two X-class and the one M-class flare.
Current usage metrics show cumulative count of Article Views (full-text article views including HTML views, PDF and ePub downloads, according to the available data) and Abstracts Views on Vision4Press platform.
Data correspond to usage on the plateform after 2015. The current usage metrics is available 48-96 hours after online publication and is updated daily on week days.
Initial download of the metrics may take a while.