Fig. 6.
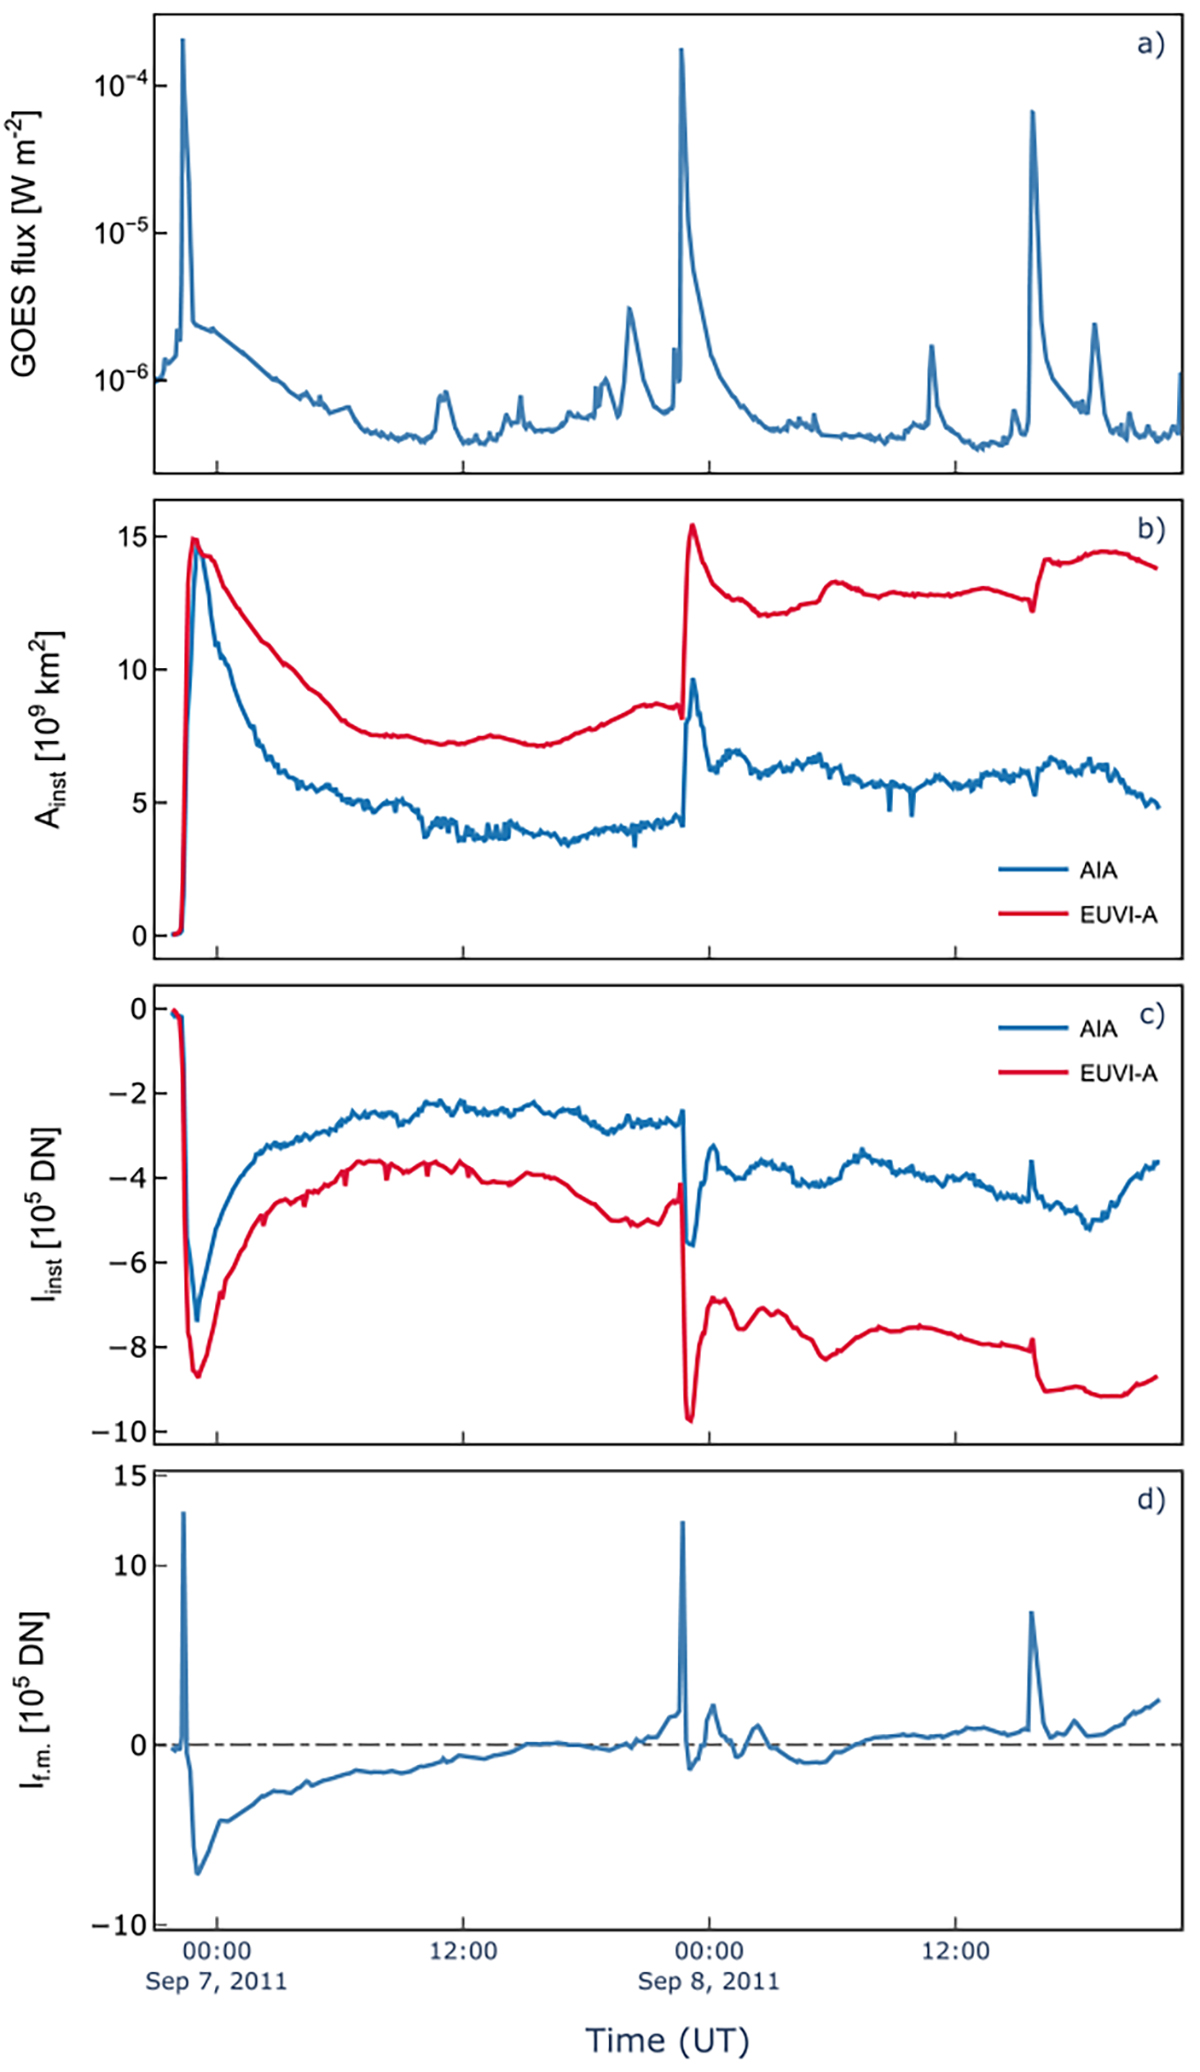
Download original image
Evolution of dimming area and brightness in the September 6, 2011, event. The data from STEREO, having a higher cadence, are smoothed. (a) GOES 1−8 Å soft X-ray flux. (b) Instantaneous dimming area evolution over time for SDO/AIA 211 Å data (blue curve) and STEREO/EUVI-A 195 Å data (red curve). (c) Instantaneous dimming brightness evolution over time. Showing the comparison between SDO/AIA (blue curve) vs STEREO/EUVI-A (red curve). (d) Instantaneous brightness evolution within the fixed mask. The dashed horizontal line marks the pre-event brightness level.
Current usage metrics show cumulative count of Article Views (full-text article views including HTML views, PDF and ePub downloads, according to the available data) and Abstracts Views on Vision4Press platform.
Data correspond to usage on the plateform after 2015. The current usage metrics is available 48-96 hours after online publication and is updated daily on week days.
Initial download of the metrics may take a while.