Fig. 5.
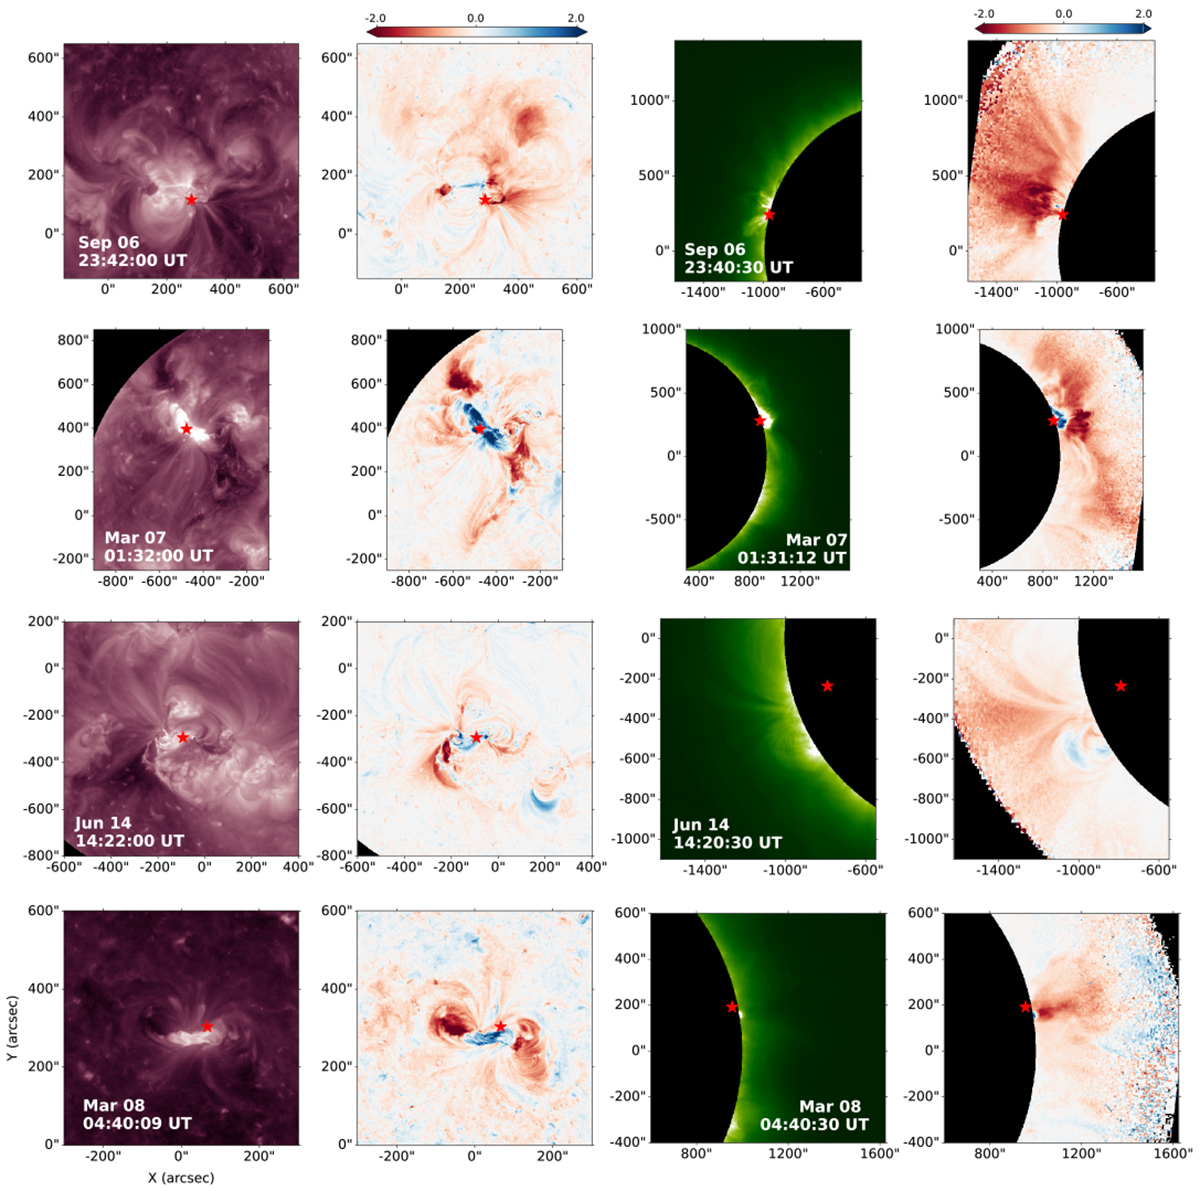
Download original image
Snapshot of all the four cases under study. From top to bottom: September 6, 2011; March 7, 2012; June 14, 2012; and March 8, 2019. The shown time instant corresponds to when the dimming is close to its maximum extension. Left column: original SDO/AIA image. Middle left column: LBR image corresponding to the SDO/AIA direct image. Middle right column: original STEREO/EUVI image of the Sun. Right column: LBR image corresponding to the original STEREO/EUVI. The colorbar of the LBR images is based on the interval from −2 to 2, highlighting both decreases (red) and increases (blue) in emission. Red asterisks indicate flare coordinates for every event.
Current usage metrics show cumulative count of Article Views (full-text article views including HTML views, PDF and ePub downloads, according to the available data) and Abstracts Views on Vision4Press platform.
Data correspond to usage on the plateform after 2015. The current usage metrics is available 48-96 hours after online publication and is updated daily on week days.
Initial download of the metrics may take a while.