Open Access
Fig. 2.
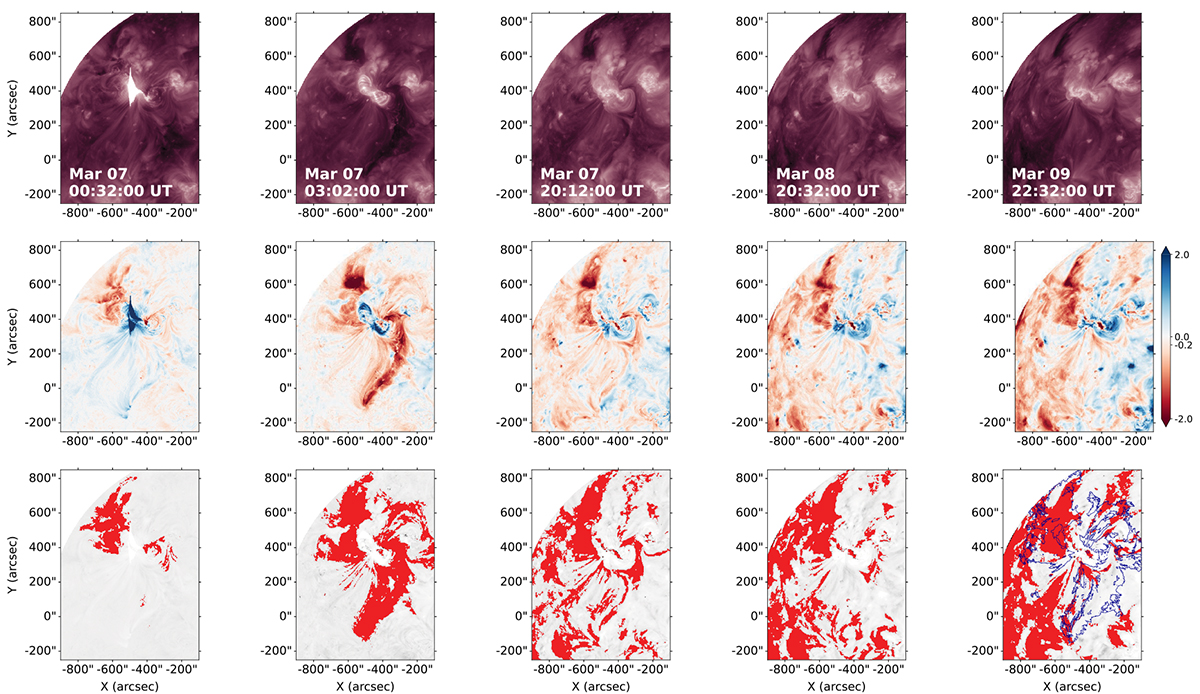
Download original image
Same as in Fig. 1, but for the event on March 7, 2012. The time series covers 72 hours starting 30 min before the associated event, with a temporal cadence for the images acquisition of 5 min for the first 24 h and 30 min for the successive 48 h of the analysis. The associated movie is available online.
Current usage metrics show cumulative count of Article Views (full-text article views including HTML views, PDF and ePub downloads, according to the available data) and Abstracts Views on Vision4Press platform.
Data correspond to usage on the plateform after 2015. The current usage metrics is available 48-96 hours after online publication and is updated daily on week days.
Initial download of the metrics may take a while.