Fig. 18.
Download original image
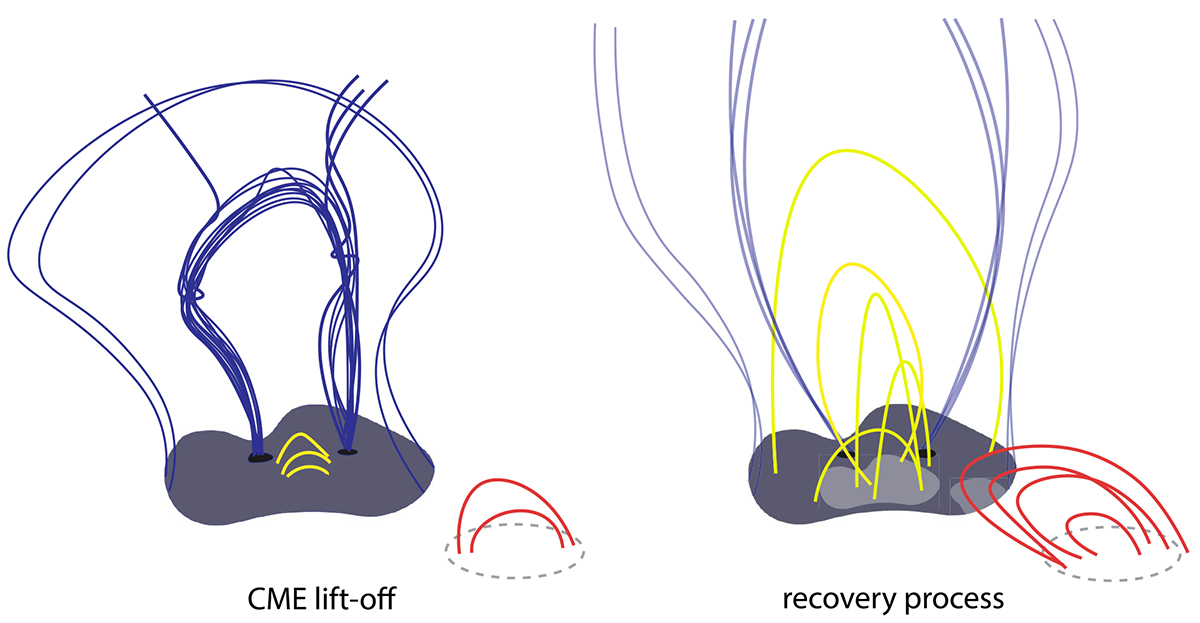
Cartoon depicting the recovery process due to the expansion of coronal loops (indicated in yellow and red) into the dimming region (gray). The CME structure is shown in blue with dark gray footpoints, referring to core dimming regions. The dashed circle indicates a nearby active region (AR). Recovering areas of the dimming are highlighted in light gray color.
Current usage metrics show cumulative count of Article Views (full-text article views including HTML views, PDF and ePub downloads, according to the available data) and Abstracts Views on Vision4Press platform.
Data correspond to usage on the plateform after 2015. The current usage metrics is available 48-96 hours after online publication and is updated daily on week days.
Initial download of the metrics may take a while.