Fig. 10.
Download original image
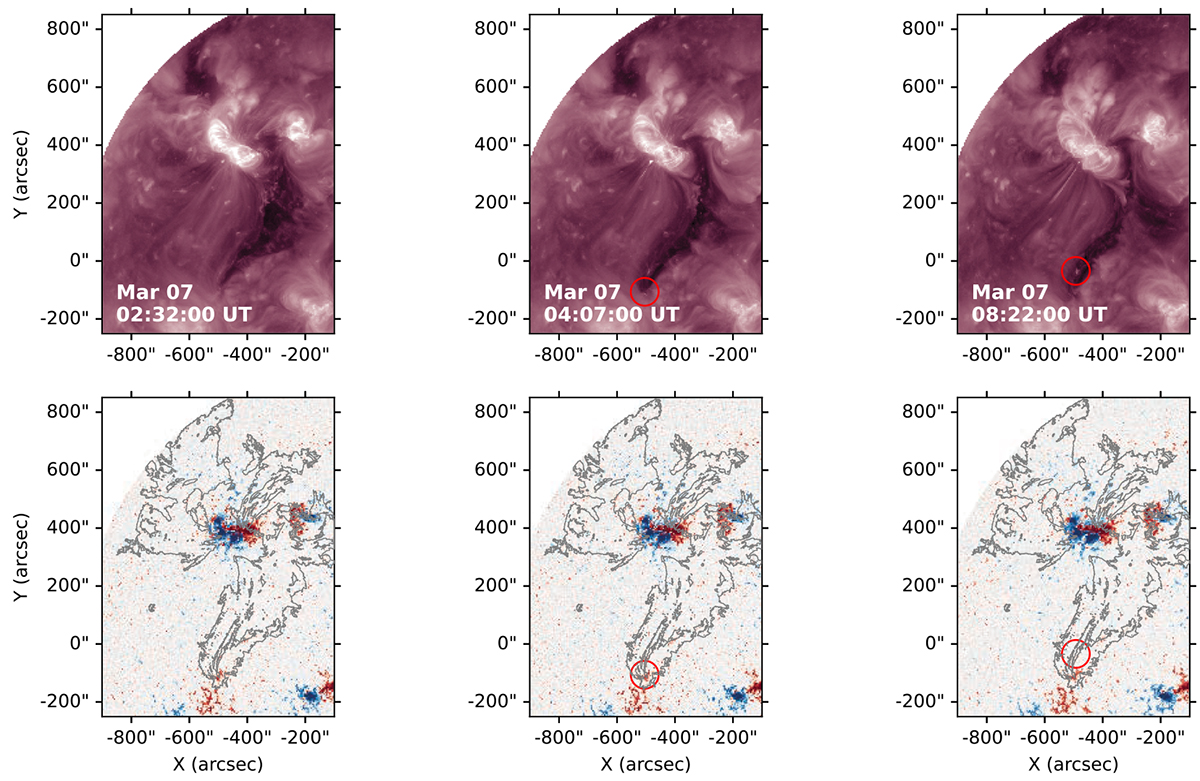
SDO/AIA 211 Å original images (top panels) and HMI LOS magnetograms (bottom panels, scaled from −750 G to +750 G) on March 7, 2012, at 02:32, 04:07, and 08:22 UT. The red circles mark observed brightenings in AIA. The gray contours present the contour of the largest instantaneous dimming mask used for the analysis of the dimming intensity evolution. They indicate flux emergence and interchange reconnection inside the dimming region.
Current usage metrics show cumulative count of Article Views (full-text article views including HTML views, PDF and ePub downloads, according to the available data) and Abstracts Views on Vision4Press platform.
Data correspond to usage on the plateform after 2015. The current usage metrics is available 48-96 hours after online publication and is updated daily on week days.
Initial download of the metrics may take a while.