Fig. 1.
Download original image
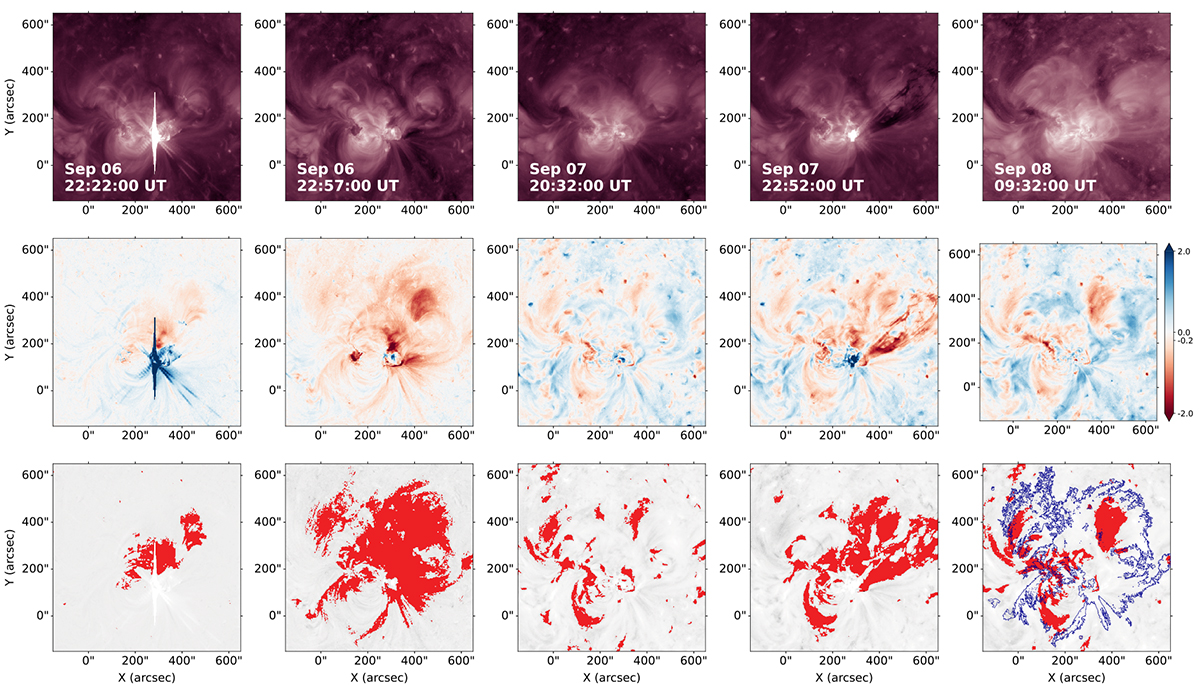
Snapshots of the evolution of the coronal dimming region of the event on September 6, 2011. Top row: time sequence of SDO/AIA 211 Å filtergrams. Center row: corresponding Logarithmic Base-Ratio (LBR) images scaled to the range −2 to 2 DN, highlighting both decreases (red) and increases (blue) in emission. Bottom row: instantaneous dimming pixel mask (in red) on top of the LBR image in grayscale. In the bottom right panel, the blue contour of the largest dimming mask within the first two hours of the event evolution is shown on top of the instantaneous dimming mask. The associated movie is available online.
Current usage metrics show cumulative count of Article Views (full-text article views including HTML views, PDF and ePub downloads, according to the available data) and Abstracts Views on Vision4Press platform.
Data correspond to usage on the plateform after 2015. The current usage metrics is available 48-96 hours after online publication and is updated daily on week days.
Initial download of the metrics may take a while.