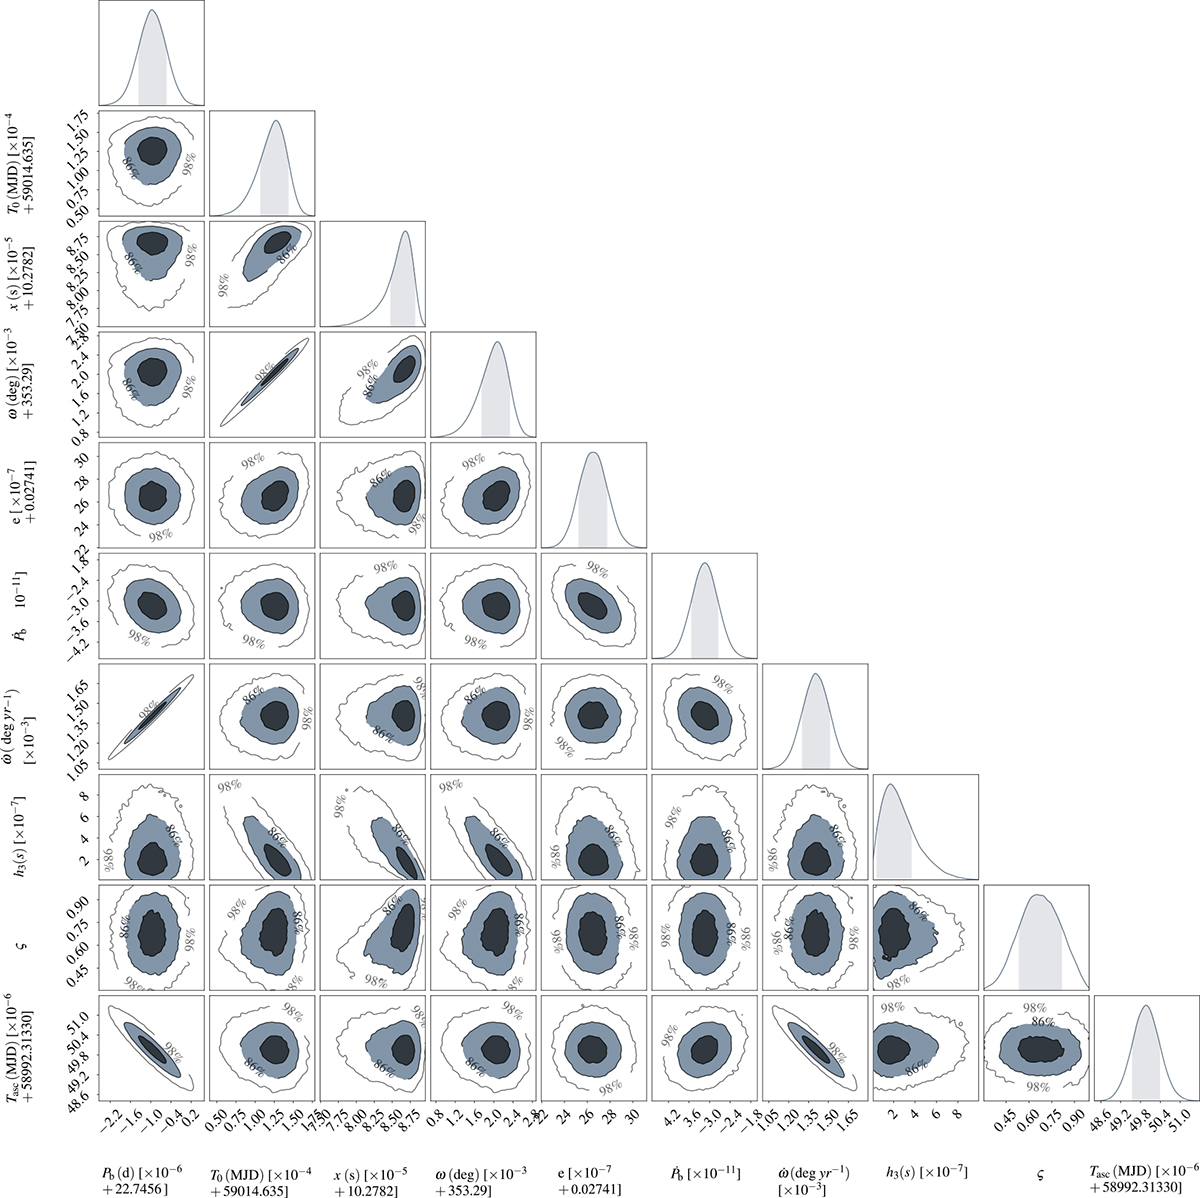
Fig. 7.
Download original image
Corner plot for the relevant subset of timing parameters from the DDH model for J1618−3921 derived by applying the DDH binary models to the ToA data set applying non-linear Bayesian timing techniques using the software TEMPONEST to the ToAs set shown in Fig. 6. The diagonal elements show the 1D marginalised posterior distributions for each parameter, the shaded region indicates the 1σ credibility interval. The 2D contours populating the off-diagonal elements show the correlation between pairs of parameters, where the lines mark the 39%, 86% and 98% credibility regions, going from dark to light shaded.
Current usage metrics show cumulative count of Article Views (full-text article views including HTML views, PDF and ePub downloads, according to the available data) and Abstracts Views on Vision4Press platform.
Data correspond to usage on the plateform after 2015. The current usage metrics is available 48-96 hours after online publication and is updated daily on week days.
Initial download of the metrics may take a while.