Fig. 2.
Download original image
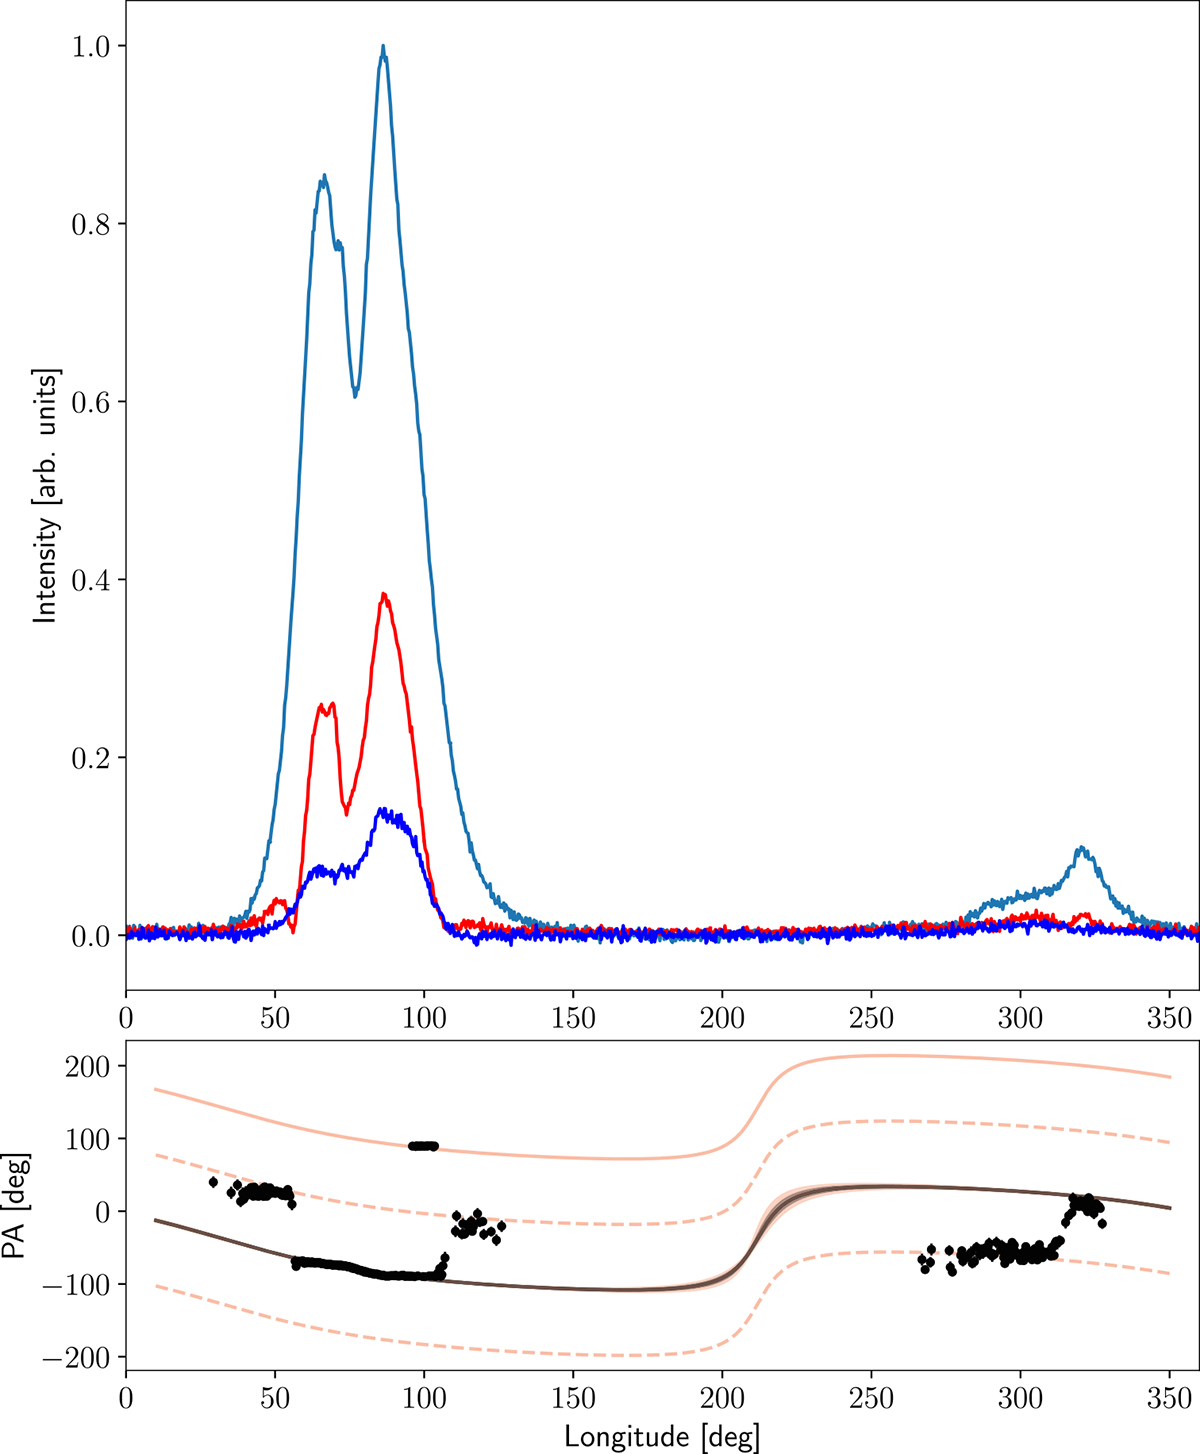
Polarisation profile of J1618−3921 obtained from integrating 29 hours of observations with the MeerKAT L-band receiver. The upper part shows the total intensity (light blue), as well as the linear (red) and circular polarisation (dark blue) fraction. The lower part shows the evolution of the position angle (PA) across the pulsar’s phase. The PA exhibits the characteristic swing as well as some phase jumps. The solid red line corresponds to the RVM fit to the PA, while the narrow grey band indicates the uncertainties of the fit result. The dashed line marks the RVM solution separated by 90 deg from the main one in order to include the jumped PA values. Details on the fit and the PA behaviour are discussed in Sect. 3.2.
Current usage metrics show cumulative count of Article Views (full-text article views including HTML views, PDF and ePub downloads, according to the available data) and Abstracts Views on Vision4Press platform.
Data correspond to usage on the plateform after 2015. The current usage metrics is available 48-96 hours after online publication and is updated daily on week days.
Initial download of the metrics may take a while.