Fig. 10.
Download original image
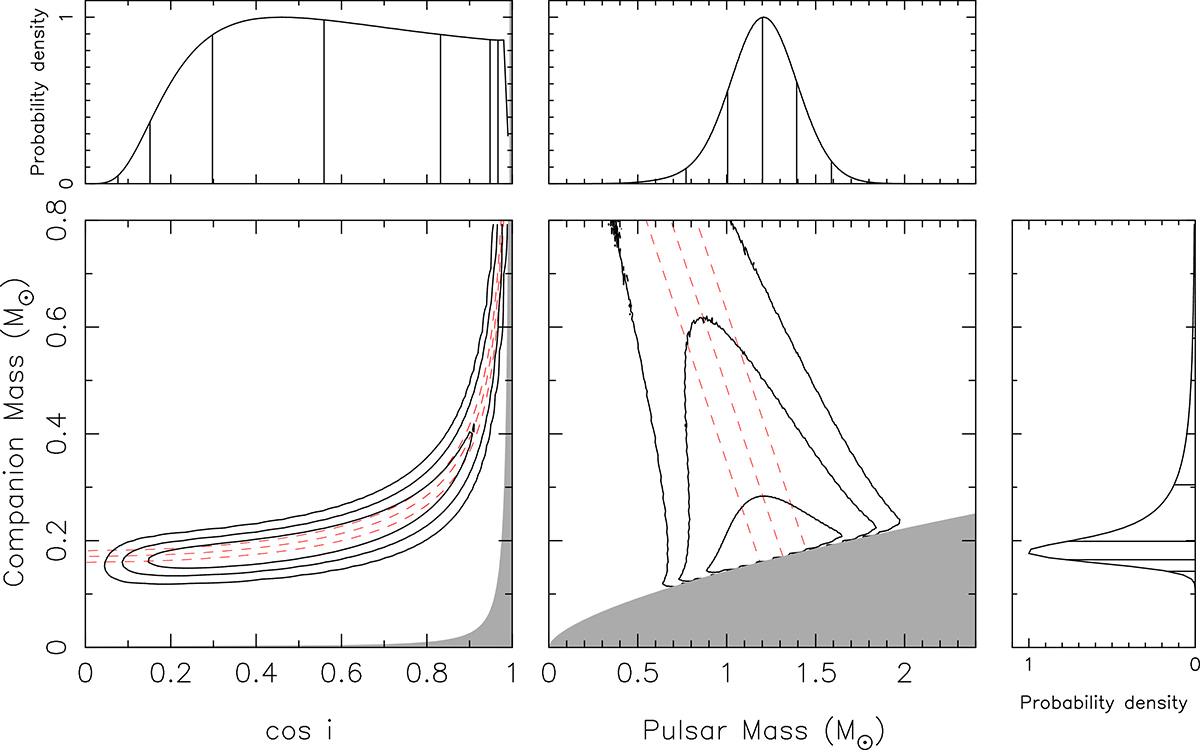
Constraints on the orbital inclination and masses of the J1618−3921 binary. The dashed red lines correspond to constraints derived from the TEMPONEST fit for the rate of advance of periastron ![]() presented in Table 3 assuming the validity of GR and regarding the effect as purely relativistic. The black lines include 68.3 and 95.4% of all probability of the 2-dimensional probability distribution functions (pdfs) derived from the χ2 map. The left of the two inner plots shows the Mc-cosι diagram, that was sampled evenly. The grey area is excluded because MPSR must be positive. The plot to its right shows the projection of the Mc-cosι pdf on the MPSR-Mc space using the mass function. The grey area is excluded because sinι ≤ 1. The outer three plots display the projected distributions for cosι, MPSR, and Mc. the hatched area corresponds to the 1σ intervals. The unconstrained inclination angle shows that we have a non-detection of the Shapiro delay; thus, we do not provide the confidence intervals.
presented in Table 3 assuming the validity of GR and regarding the effect as purely relativistic. The black lines include 68.3 and 95.4% of all probability of the 2-dimensional probability distribution functions (pdfs) derived from the χ2 map. The left of the two inner plots shows the Mc-cosι diagram, that was sampled evenly. The grey area is excluded because MPSR must be positive. The plot to its right shows the projection of the Mc-cosι pdf on the MPSR-Mc space using the mass function. The grey area is excluded because sinι ≤ 1. The outer three plots display the projected distributions for cosι, MPSR, and Mc. the hatched area corresponds to the 1σ intervals. The unconstrained inclination angle shows that we have a non-detection of the Shapiro delay; thus, we do not provide the confidence intervals.
Current usage metrics show cumulative count of Article Views (full-text article views including HTML views, PDF and ePub downloads, according to the available data) and Abstracts Views on Vision4Press platform.
Data correspond to usage on the plateform after 2015. The current usage metrics is available 48-96 hours after online publication and is updated daily on week days.
Initial download of the metrics may take a while.