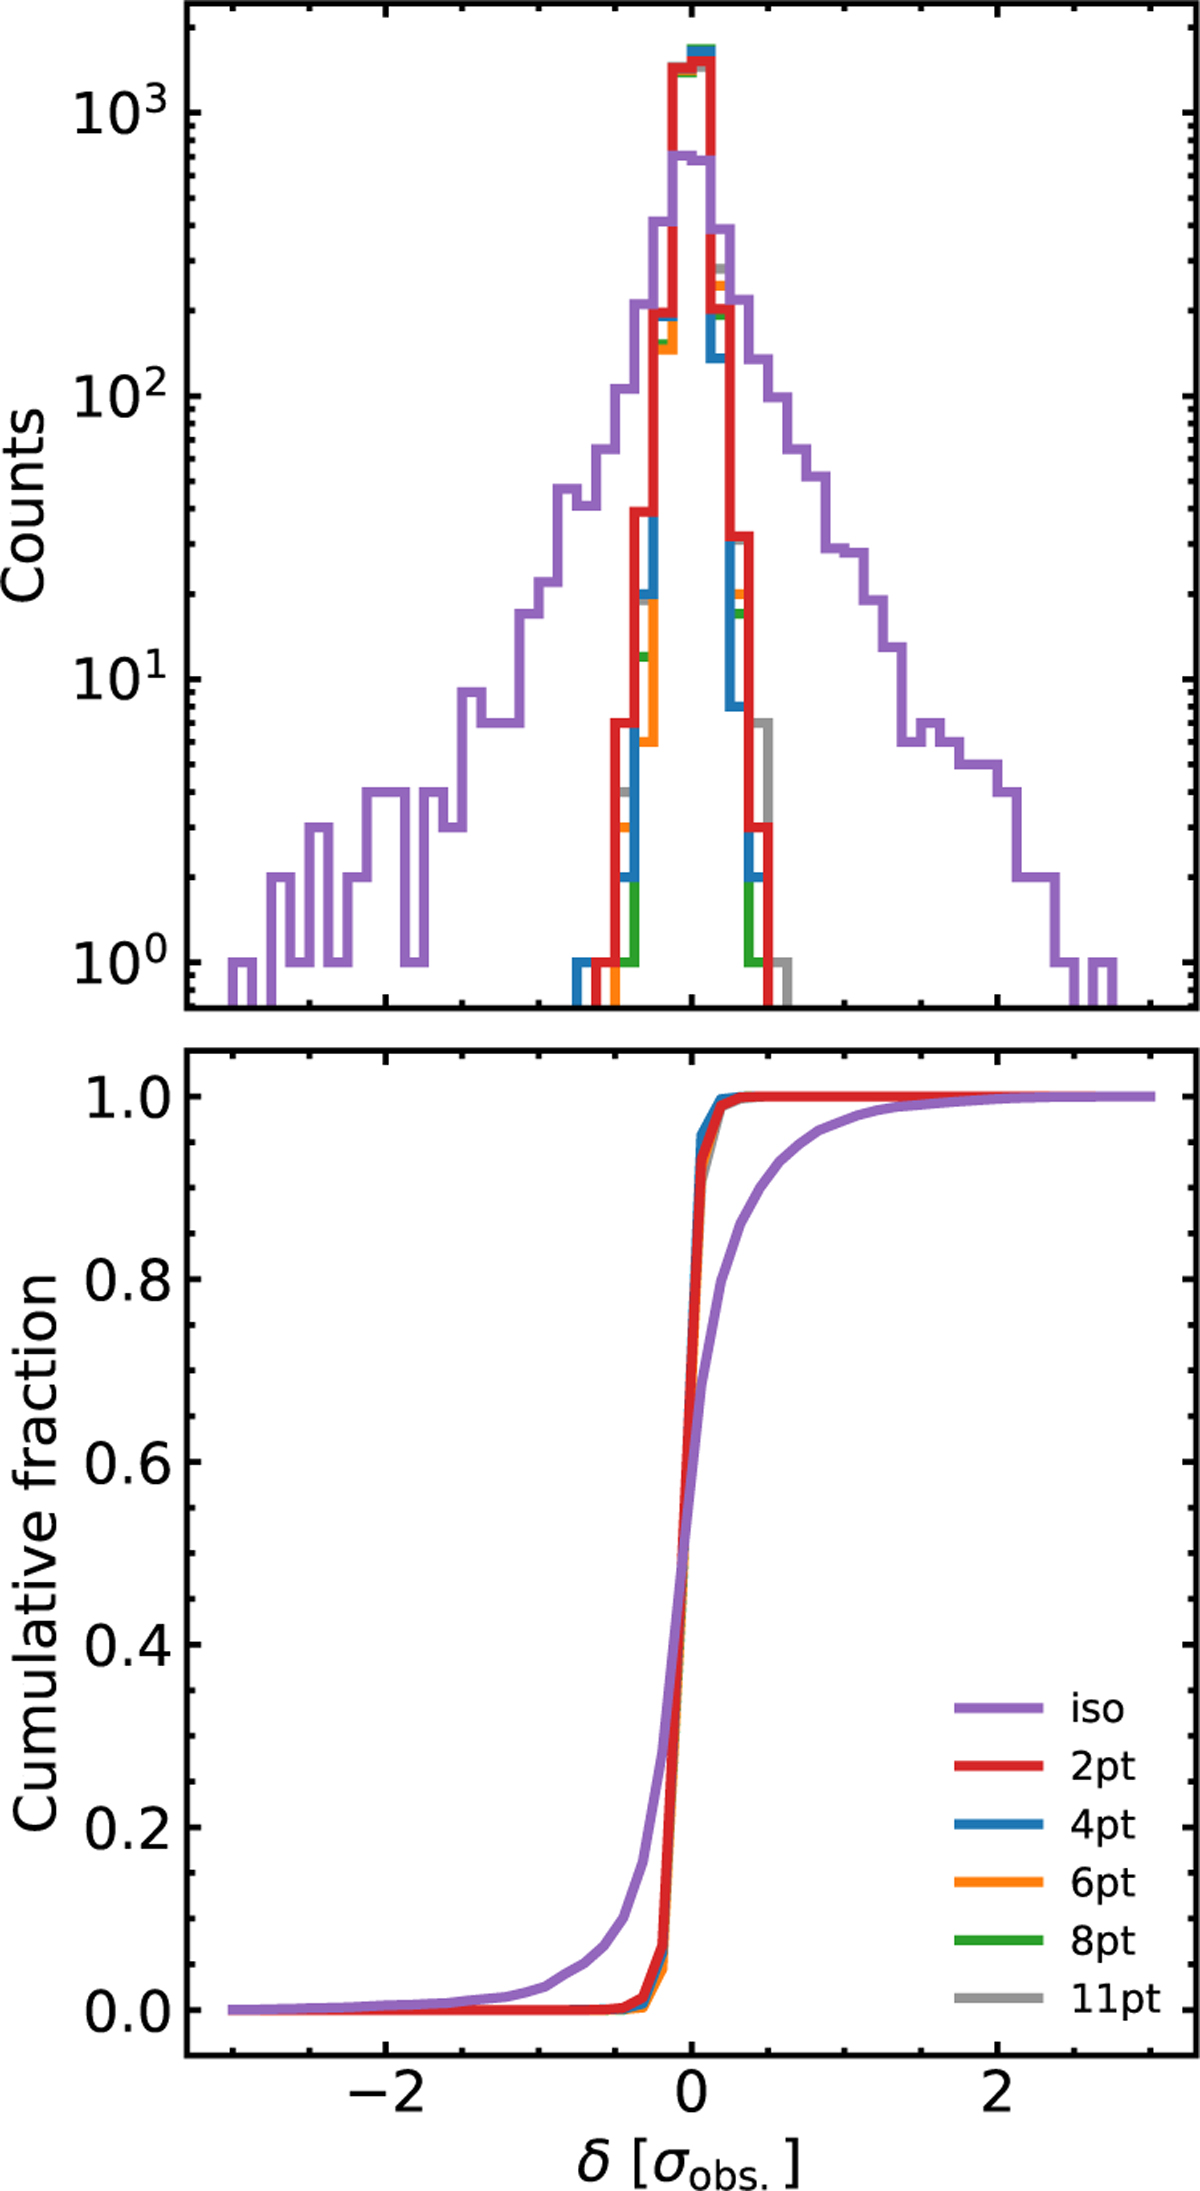
Fig. B.1
Download original image
Distributions of retrieval residuals (scaled to the observational error bar, σobs), counted in bins with a width of 0.25 σobs. (Top) Total number of counts per bin. (Bottom) Cumulative fraction of residuals. Both panels show the collected distribution of residuals from retrievals applied to each of the twelve synthetic transmission spectra, but counted separately for each pressure–temperature prescription.
Current usage metrics show cumulative count of Article Views (full-text article views including HTML views, PDF and ePub downloads, according to the available data) and Abstracts Views on Vision4Press platform.
Data correspond to usage on the plateform after 2015. The current usage metrics is available 48-96 hours after online publication and is updated daily on week days.
Initial download of the metrics may take a while.