Fig. 1
Download original image
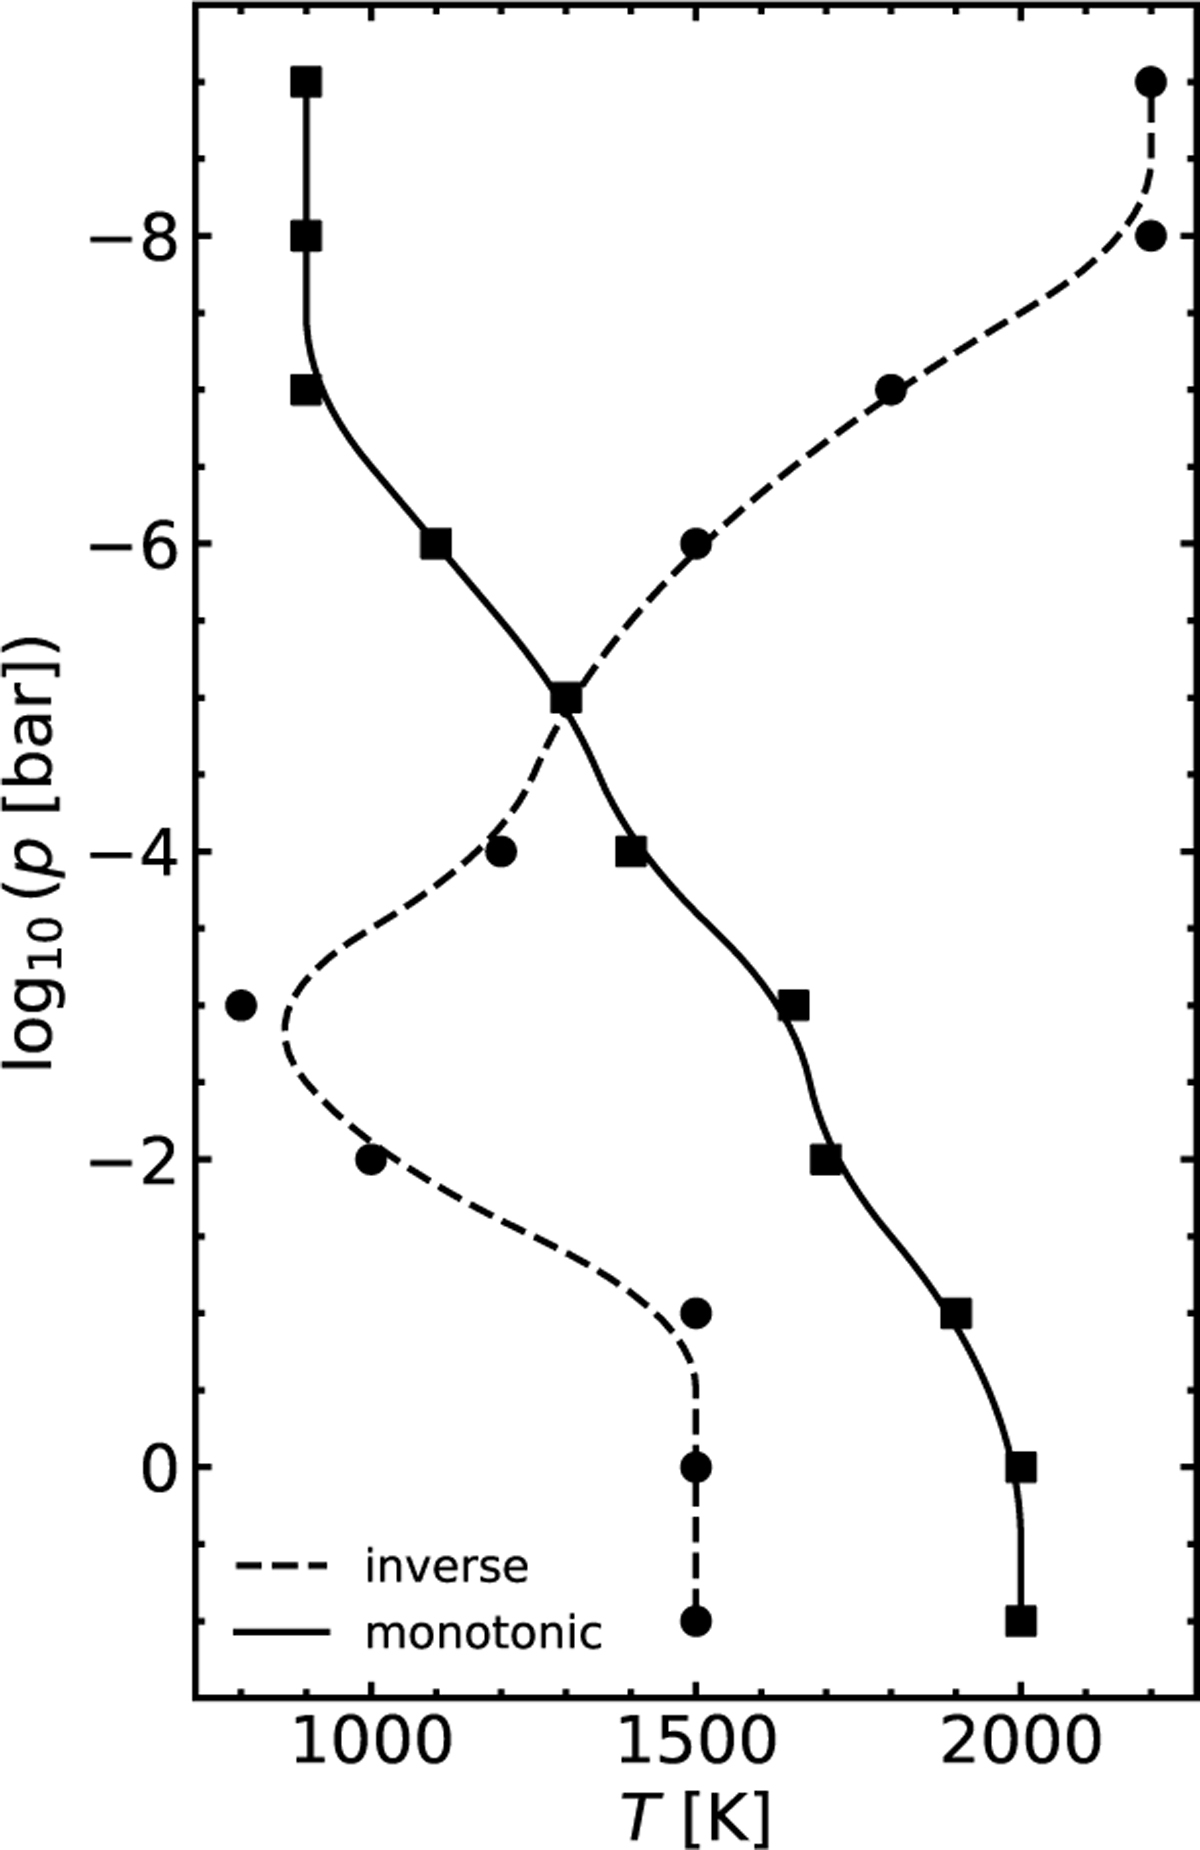
Constructed pressure-temperature profiles, which are used to create synthetic transmission spectra for our test cases. Temperature (in K) is shown on the x-axis and pressure (in bar) on the y-axis. The (p. T)-pairs (filled markers) are log-uniformly distributed in the pressure regime of the atmosphere. The shapes of the two profiles characterise a simpler, purely positive temperate lapse rate (solid line) and a more complex structure including a temperature inversion point (dashed line). We note that the (p, T)-pair at p = 10−5 bar is the same for both cases.
Current usage metrics show cumulative count of Article Views (full-text article views including HTML views, PDF and ePub downloads, according to the available data) and Abstracts Views on Vision4Press platform.
Data correspond to usage on the plateform after 2015. The current usage metrics is available 48-96 hours after online publication and is updated daily on week days.
Initial download of the metrics may take a while.