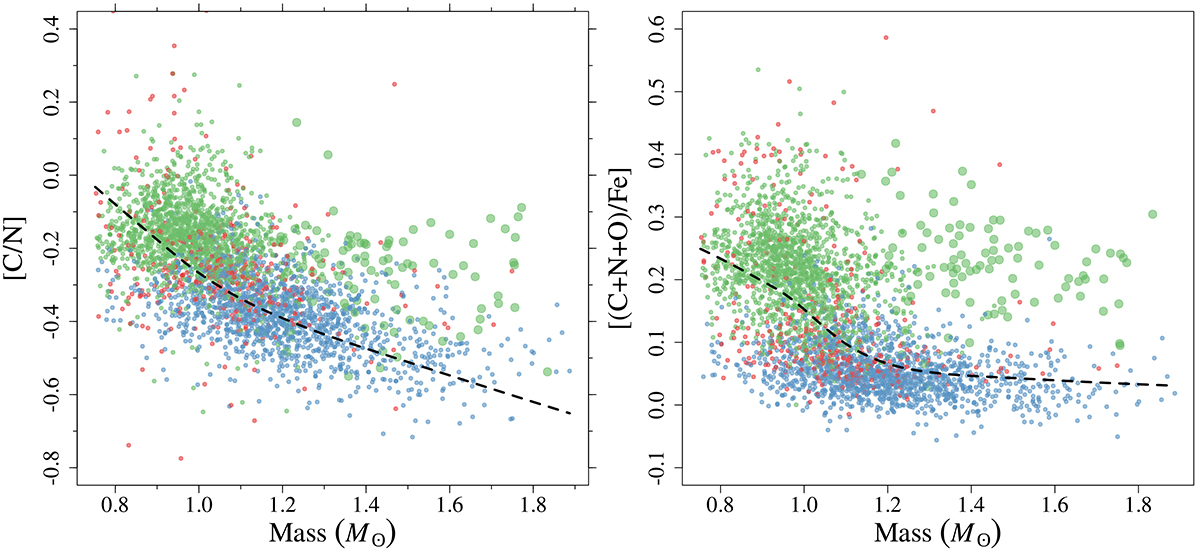
Fig. 8.
Download original image
Evolution of surface abundance of different elements with stellar mass. Left: [C/N] ratio evolution. The dashed line shows the predictions from stellar models. The larger symbols identify young α-rich stars according to the Grisoni et al. (2024) classification. Right: Same as in the left panel but for the [(C+N+O)/Fe] ratio trend.
Current usage metrics show cumulative count of Article Views (full-text article views including HTML views, PDF and ePub downloads, according to the available data) and Abstracts Views on Vision4Press platform.
Data correspond to usage on the plateform after 2015. The current usage metrics is available 48-96 hours after online publication and is updated daily on week days.
Initial download of the metrics may take a while.