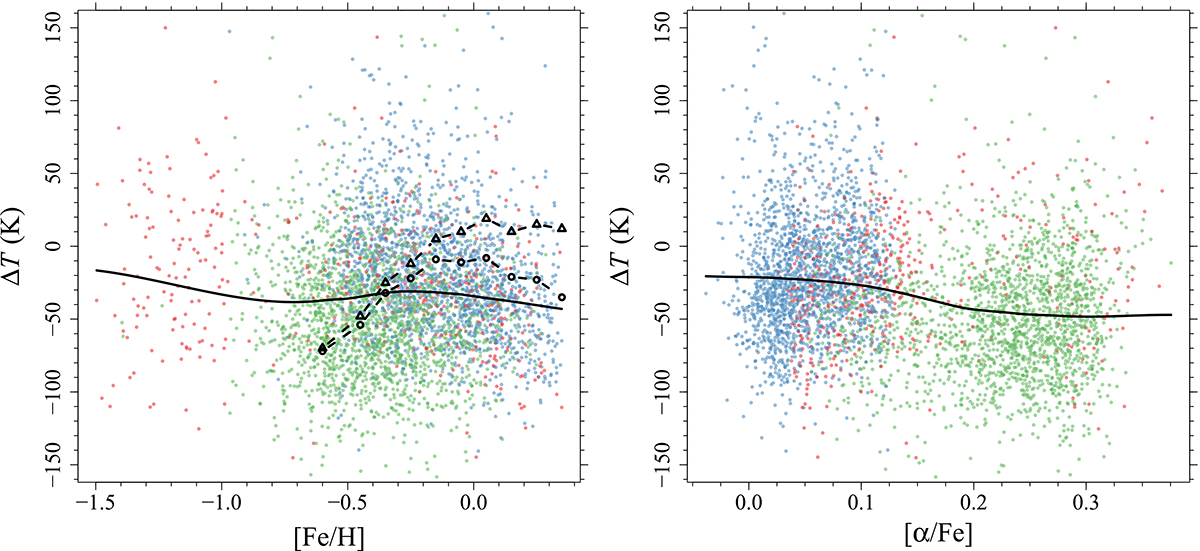
Fig. 1.
Download original image
Effective temperature difference between observations and models as a function of different observational parameters. Left: ΔT vs [Fe/H]. Colours identify stars as in the APO-K2 catalogue (green = high α, blue = low α, red = transition). The black solid line represent a loess smoothing of the data. Open circles show the trend reported in Salaris et al. (2018), while open triangles show the trend by Tayar et al. (2017), shifted downward by 100 K. Right: Same as in the left panel but as a function of [α/Fe].
Current usage metrics show cumulative count of Article Views (full-text article views including HTML views, PDF and ePub downloads, according to the available data) and Abstracts Views on Vision4Press platform.
Data correspond to usage on the plateform after 2015. The current usage metrics is available 48-96 hours after online publication and is updated daily on week days.
Initial download of the metrics may take a while.