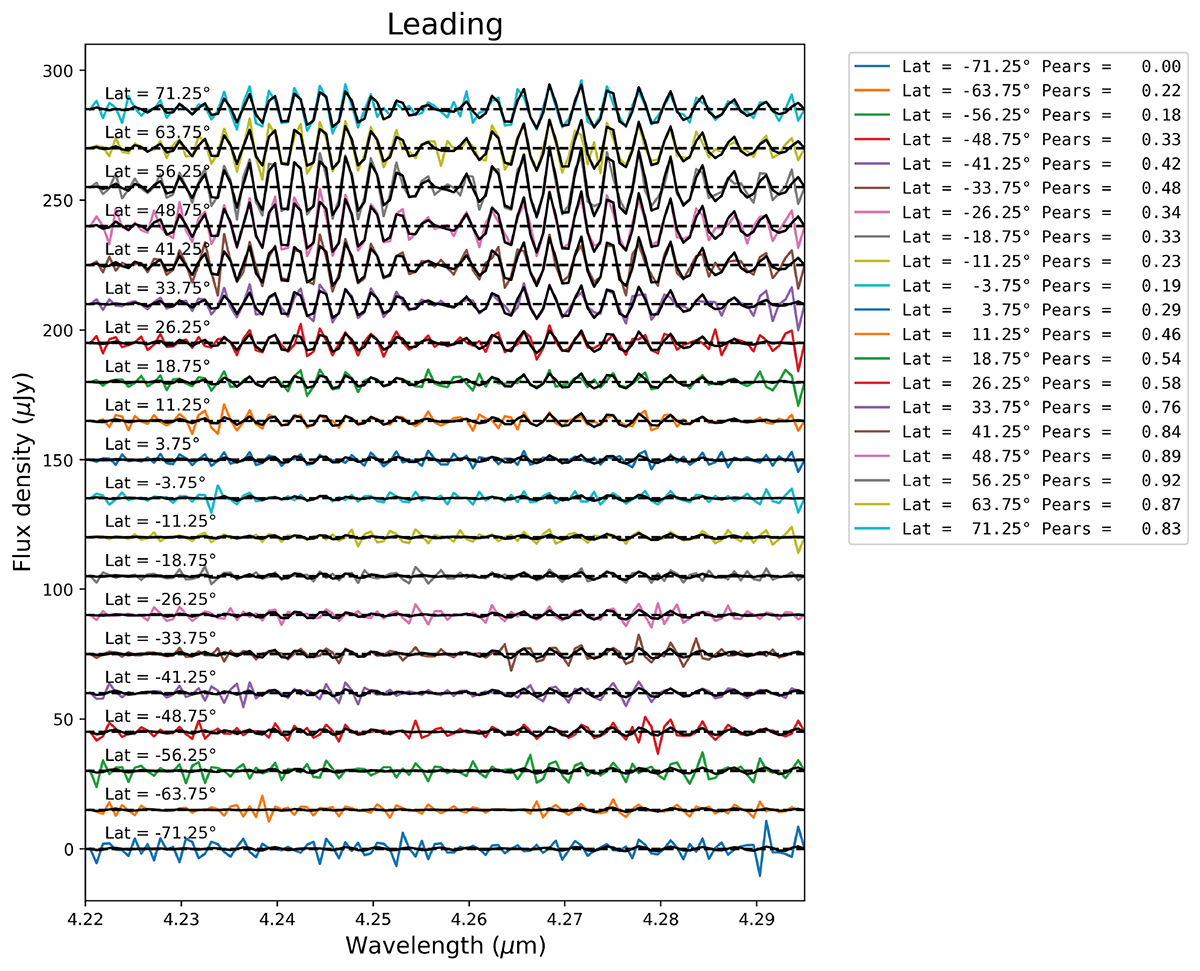
Fig. B.2.
Download original image
DIFF spectra on the leading hemisphere as a function of latitude. Data were averaged over latitude bins of 7.5° and treated as explained in Appendix B. Fitted fluorescence DIFF spectra are shown in black. The Pearson correlation coefficient for each spectrum is given in the legend. Vertical-axis unit is the flux density per pixel.
Current usage metrics show cumulative count of Article Views (full-text article views including HTML views, PDF and ePub downloads, according to the available data) and Abstracts Views on Vision4Press platform.
Data correspond to usage on the plateform after 2015. The current usage metrics is available 48-96 hours after online publication and is updated daily on week days.
Initial download of the metrics may take a while.