Fig. N.1.
Download original image
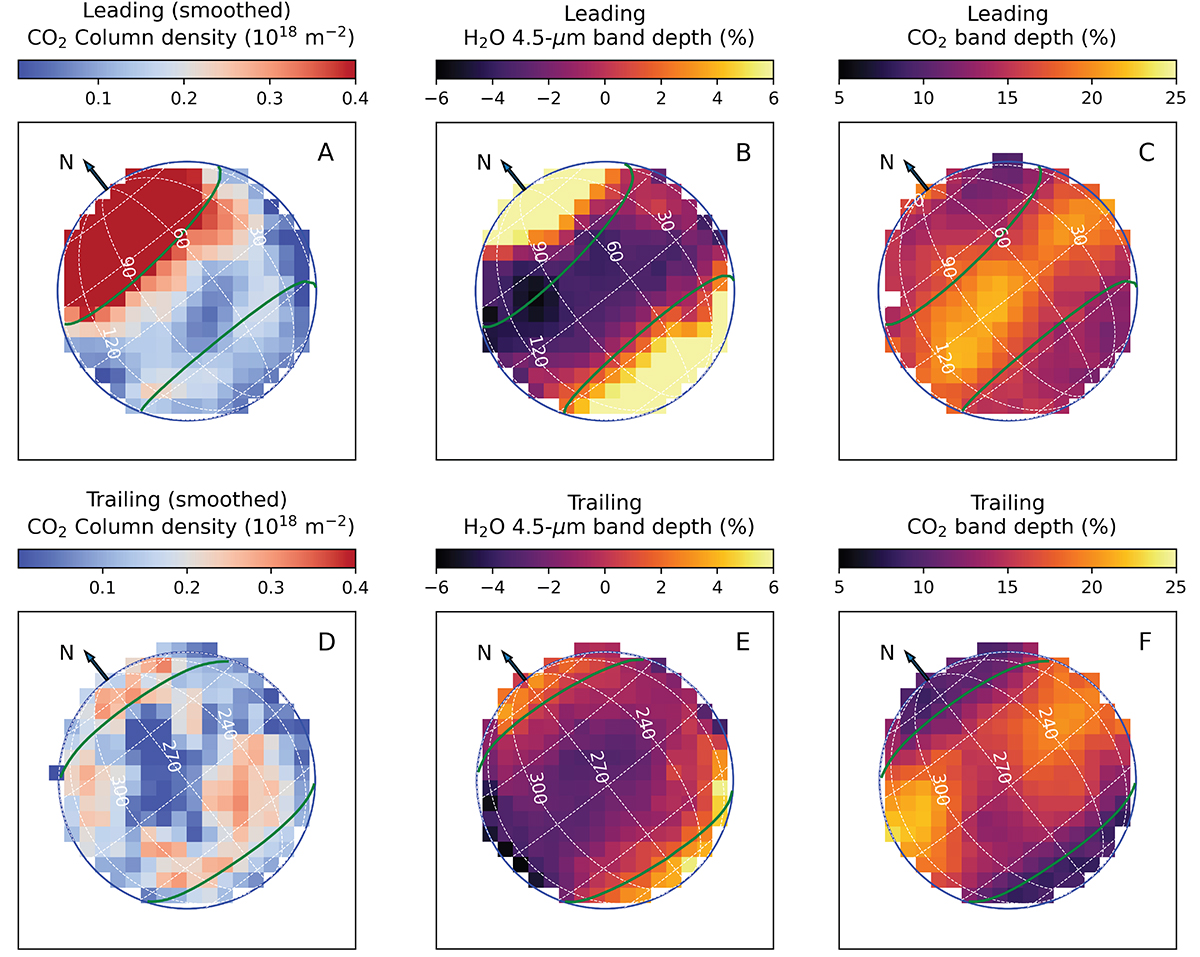
Comparing CO2 exosphere to H2O and CO2 distribution on Ganymede’s surface. Top and bottom rows are for the leading and trailing hemispheres, respectively. A, D: CO2 gas column density maps at a 3×3 smoothed resolution (this work); B, E: H2O band depth at 4.5 μm (Paper I); C, F: CO2-solid 4.3-μm band depth (Paper I). In these plots, unlike in Figs 1 and O.1, the same color scales and boxcar smoothing are used for leading and trailing.
Current usage metrics show cumulative count of Article Views (full-text article views including HTML views, PDF and ePub downloads, according to the available data) and Abstracts Views on Vision4Press platform.
Data correspond to usage on the plateform after 2015. The current usage metrics is available 48-96 hours after online publication and is updated daily on week days.
Initial download of the metrics may take a while.