Fig. M.1.
Download original image
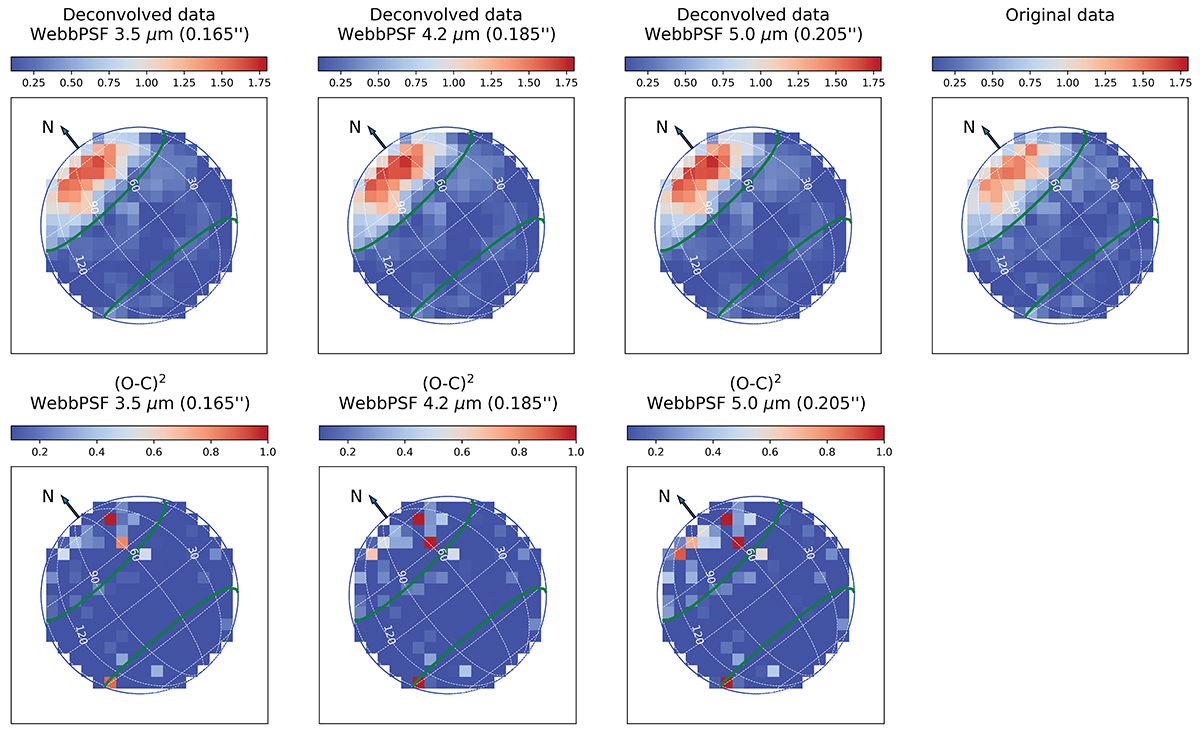
PSF deconvolution. Top: deconvolved CO2-gas maps (leading hemisphere) obtained with the AIDA algorithm using NIRSpec PSFs calculated with WebbPSF at 3.5 μm (FWHM = 0.165”), 4.2 μm (FWHM = 0.185”) and 5 μm (FWHM = 0.205”). Bottom: residuals of the deconvolution for each calculated PSF; plotted are (O − C)2, where O is the original CO2 column-density map (leading hemisphere, top-right plot), and C is the convolution of the deconvolved O map. Color bars are in unit of 1018 m−2.
Current usage metrics show cumulative count of Article Views (full-text article views including HTML views, PDF and ePub downloads, according to the available data) and Abstracts Views on Vision4Press platform.
Data correspond to usage on the plateform after 2015. The current usage metrics is available 48-96 hours after online publication and is updated daily on week days.
Initial download of the metrics may take a while.