Open Access
Fig. L.1.
Download original image
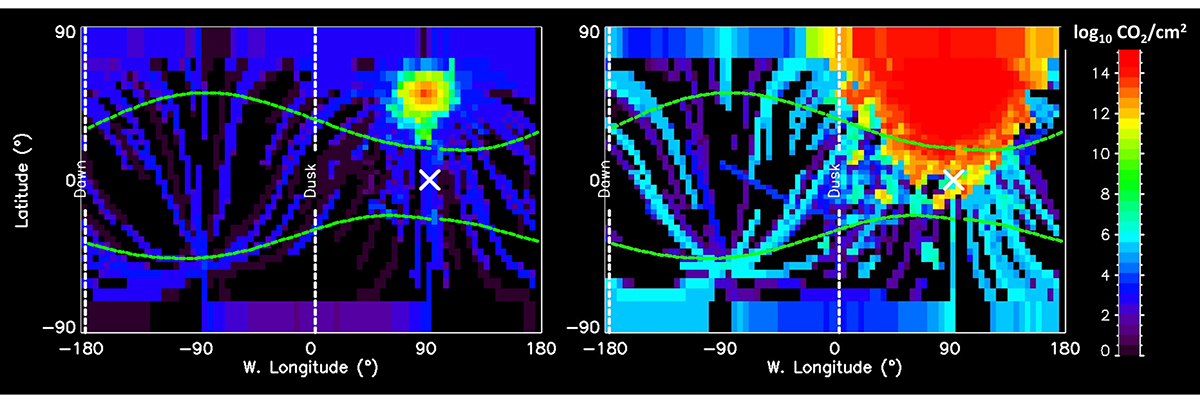
Vertical CO2 column density using a distribution of temperature at each location (rough surface, left panel) or the mean temperature (right panel). The simulations consider the sublimation of CO2 ice from a 300×300 km region at 52°N, with qCO2 × fc = 3 ×10⁻¹⁴.
Current usage metrics show cumulative count of Article Views (full-text article views including HTML views, PDF and ePub downloads, according to the available data) and Abstracts Views on Vision4Press platform.
Data correspond to usage on the plateform after 2015. The current usage metrics is available 48-96 hours after online publication and is updated daily on week days.
Initial download of the metrics may take a while.