Fig. A.1
Download original image
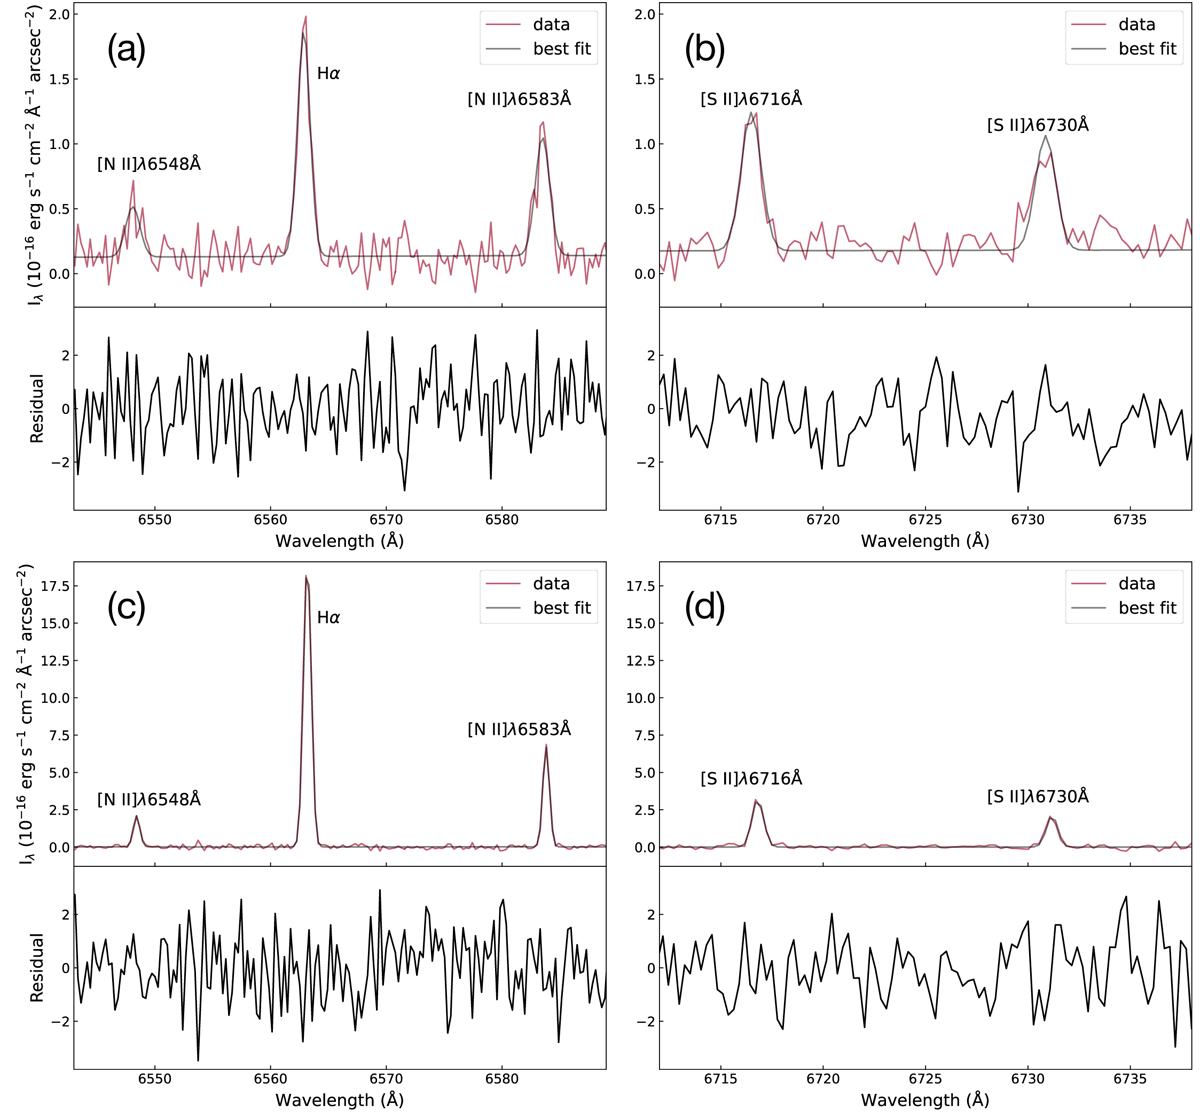
Example spectra (red solid lines) of (a, b) HB9 extracted on 2024.03.29 at the position of the acquisition star (d = 0, No.= 25; Fig. 1) and (c, d) G159.2+3.3 extracted on 2024.03.27 at d = −2.25′ from the acquisition star (No.= 15; Fig. 2). The grey solid curve is the best-fit to the spectra with Gaussian models plus a linear continuum. The lower panels show the spectral fit residuals defined as (model - data)/error. The slight difference in the residual continuum level in the upper and lower panels is caused by the imperfect local background modelling and subtraction, which however, does not affect the modelling of the emission lines.
Current usage metrics show cumulative count of Article Views (full-text article views including HTML views, PDF and ePub downloads, according to the available data) and Abstracts Views on Vision4Press platform.
Data correspond to usage on the plateform after 2015. The current usage metrics is available 48-96 hours after online publication and is updated daily on week days.
Initial download of the metrics may take a while.