Fig. 8
Download original image
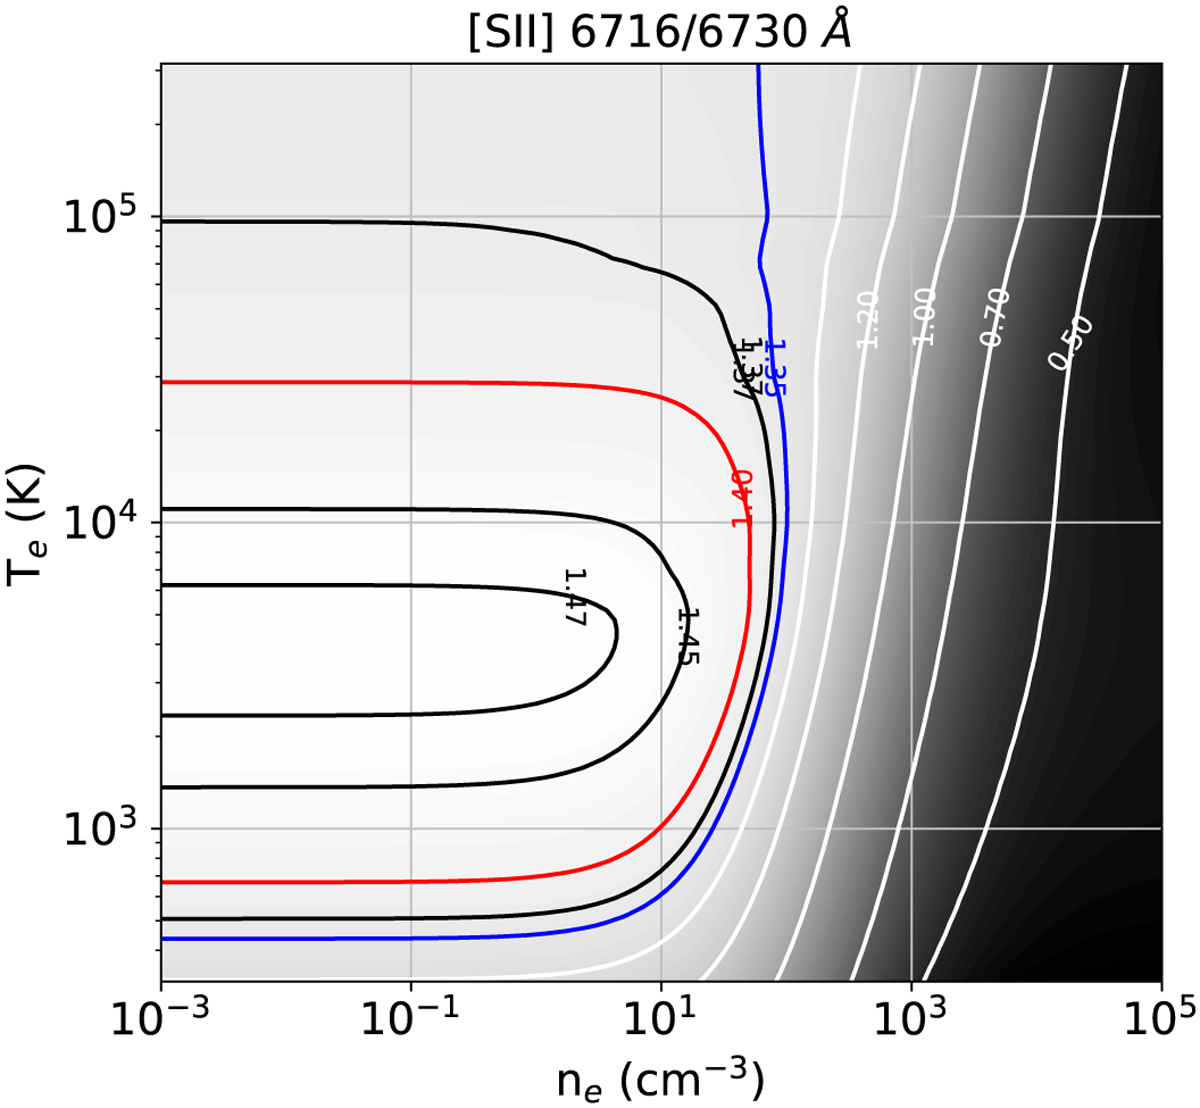
Dependence of the [S II] 6716/6730 Å line ratio on the electron number density, ne, and temperature, Te. The grey-scale image and contours are the model predictions computed using PyNeb (Luridiana et al. 2015), with the corresponding line ratios denoted beside each contour. The blue (1.35) and red (1.40) contours are the median values measured in HB9 (Fig. 5c) and G159.2+3.3 (Fig. 6c), respectively. For high-density gas with ne ≳ 102 cm−3, the [S II] 6716/6730 Å line ratio is highly density dependant so a good density tracer. On the other hand, at ne ≲ 102 cm−3, [S II] 6716/6730 Å is less sensitive to density, but more affected by temperature.
Current usage metrics show cumulative count of Article Views (full-text article views including HTML views, PDF and ePub downloads, according to the available data) and Abstracts Views on Vision4Press platform.
Data correspond to usage on the plateform after 2015. The current usage metrics is available 48-96 hours after online publication and is updated daily on week days.
Initial download of the metrics may take a while.