Fig. 5
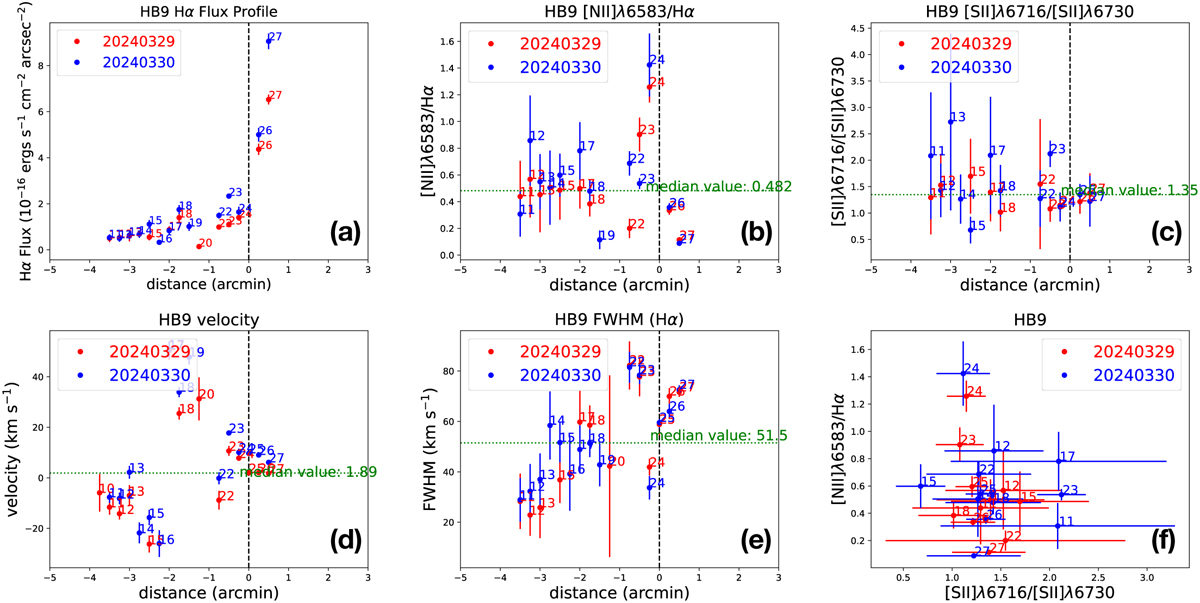
Download original image
Spatial distribution of parameters along the slit of HB9. Panels a-e are the Hα flux, the [N II]λ6583 Å/Hα flux ratio, the [S II]16716/6730 Å flux ratio, the centroid velocity, and the FWHM of the Hα line. Panel f is the [S II]16716/6730 Å-[N II]16583 Å/Hα line ratio diagram. The blue and red colours denote the data taken on the two nights, respectively. The distance in arcmin in panels a–e is measured from the bright target acquisition star, with north as negative and south as positive (Figs. 1, 3). In some panels, we also calculated the median value of the parameters (with significant outliers rejected) and denote them with a dotted green line.
Current usage metrics show cumulative count of Article Views (full-text article views including HTML views, PDF and ePub downloads, according to the available data) and Abstracts Views on Vision4Press platform.
Data correspond to usage on the plateform after 2015. The current usage metrics is available 48-96 hours after online publication and is updated daily on week days.
Initial download of the metrics may take a while.